截至2024年6月30日的債務到期情況主要銀行債務協議其他 銀行債務截至2024年6月30日的債務總額:75.53億美元固定收益租賃平均債務壽命:4.6年 1,502 1,389 1,254 1,254 1,2522 908 826 484 169 2024 2026 2027 2028 2029 2030 203100萬美元債務到期日概況不包括Cemex Holdings的債務菲律賓公司(CHP)及其子公司欠Cemex集團以外的第三方的債務,由於我們同意剝離在 {的業務,這筆債務被重新歸類為持有的21筆待售負債br} 菲律賓,根據國際財務報告準則
年初至今的合併銷量和價格與24年第二季度對比23年第二季度與24年第一季度年初至今 23年第二季度成交量 (1%) (0%) 12% 國內灰色價格 (美元) 5% 2% (0%) 水泥價格 (l-t-l) 3% 3% 1% 成交量 (10%) (9%) 10% 預拌價格 (美元) 6% 4% (1%) 價格 (l-t-l) 5% 0% 成交量 (3%) (3%) 12% 總價格 (美元) 4% 3% (2%) 價格 (l-t-l) 3% 3% (1%) 價格 (l-t-l) 在恆定外匯匯率下按交易量加權平均值計算的價格 (l-t-l) 22
其他債務信息其他第一季度墨西哥比索 3% 5% 歐元 2024% var 2024 15% 1 7,665 7,553 (1%) 7,844 債務總額 3 貨幣短期 4% 4% 4% 面額美國長期 96% 96% 96% 96% 美元 78% 現金及現金等價物 471 425 (10%) 476 淨負債 7,194 7,128 (1%) 7,369 2 7,281 7,208 (1%) 7,371 合併淨負債 2 2.45 2.13 2.18 合併槓桿率變量 2 30% 6.90 7.72 7.80 合併承保率 3 固定利率百萬美元。2024年第二季度,總負債和淨負債不包括菲律賓Cemex Holdings, Inc.(CHP)及其子公司欠Cemex集團以外的第三方70%的債務 ,因為根據國際財務報告準則,該債務被重新歸類為出售的負債, 。1) 包括租賃,根據國際財務報告準則2計算我們在主要銀行債務協議下的合同義務;包括息税折舊攤銷前利潤和我們在菲律賓業務的債務 3) 包括我們 的影響利率和跨貨幣衍生品(視情況而定)23
債務其他信息按工具劃分的債務總額2024年第一季度 第二季度佔總額的百分比 2024 年第二季度佔總固定收益的百分比 3,845 49% 3,777 50% 主銀行債務協議 2,473 32% 2% 2% 租賃1,272 16% 1,174 16% 33% 其他 254 3% 115 2% 總債務 7,844 7,553 16% 2% 百萬美元2024年第二季度包括菲律賓Cemex Holdings, Inc.(CHP)及其子公司欠Cemex集團以外的第三方的債務,因為該債務被重新歸類為根據該協議持有的待售負債 根據國際財務報告準則,剝離我們在菲律賓的業務。24
24 年第二季度成交量和價格摘要:選定的國家和地區國內 灰色水泥預拌混料總量 24 年第 2 季度與 23 年第 2 季度與 23 年第二季度成交量(美元)價格(美元)成交量(美元)價格(LC)成交量(美元)價格(LC)墨西哥 5% 3% 2% 7% 3% 3% 4% 3% 3% 美國(7%)4%(12%)7%(2%)4% 4% 歐洲 (2%) (0%) (3%) (0%) (11%) (3%) (8%) 0% 1% 歐洲 (2%) (0%) (6%) (4%) (3%) (8%) 1% MEA 6% (21%) 11% (18%) (2%) (0%) (3%) (2%) SCAC 0% 4% (8%) 19% (8%) 19% (11%) 1%) 按照 交易量計算的歐洲、中東和非洲、歐洲、中東和非洲地區和 SCAC 的 6% (2%) 價格 (LC)-按固定外匯匯率計算的加權平均值 25
年初至今 24 年第 2 季度銷量和價格摘要:部分國家和地區國內 灰色水泥預拌骨料年初至今 24 年第 2 季度與 2023 年第二季度年初至今 2 季度年初至今 2 季度年初至今 2 季度成交量(美元)價格(美元)價格(LC)成交量(美元)價格(LC)墨西哥 6% 8% 2% 14% 10% 6% 16% 11% 美國(8%)4% 4% (13%) 8% 3% 1% 1% 歐洲、中東和非洲 (2%) (0%) 1% (14%) (1%) (12%) 2% 1% 歐洲 (5%) 2% 1% (9%) (2%) (2%) (2%) 2% MEA 5% (8%) 13% (22%) (2%) (14%) (4%) (3%) SCAC (3%) 6% (8%) 5% (8%)) 23% 12% (2%) 11% 1% 價格 (LC) 適用於 EMEA、歐洲、中東和非洲地區和 SCAC 以恆定外匯匯率的交易量加權平均值計算 26
1 2024年成交量指引:部分國家/地區水泥預混料 總量持平至低個位數增幅低個位數下降幅度持平至較低個位數降幅 CEMEX 低至中個位數增長低個位數增幅墨西哥低個位數下降中位數 降幅持平至低個位數增幅美國持平至低個位數增幅低個位數下降幅度持平至低個位數下降 MEA 持平至較低的個位數跌幅 中等個位數下降幅度中位數下降SCAC 低個位數下降低個位數下降N/A 1) 反映了Cemex截至2024年7月25日的預期。成交量以點贊為基礎。本幻燈片中的所有交易量指導均以 百分比表示,與 2023 年相比 27
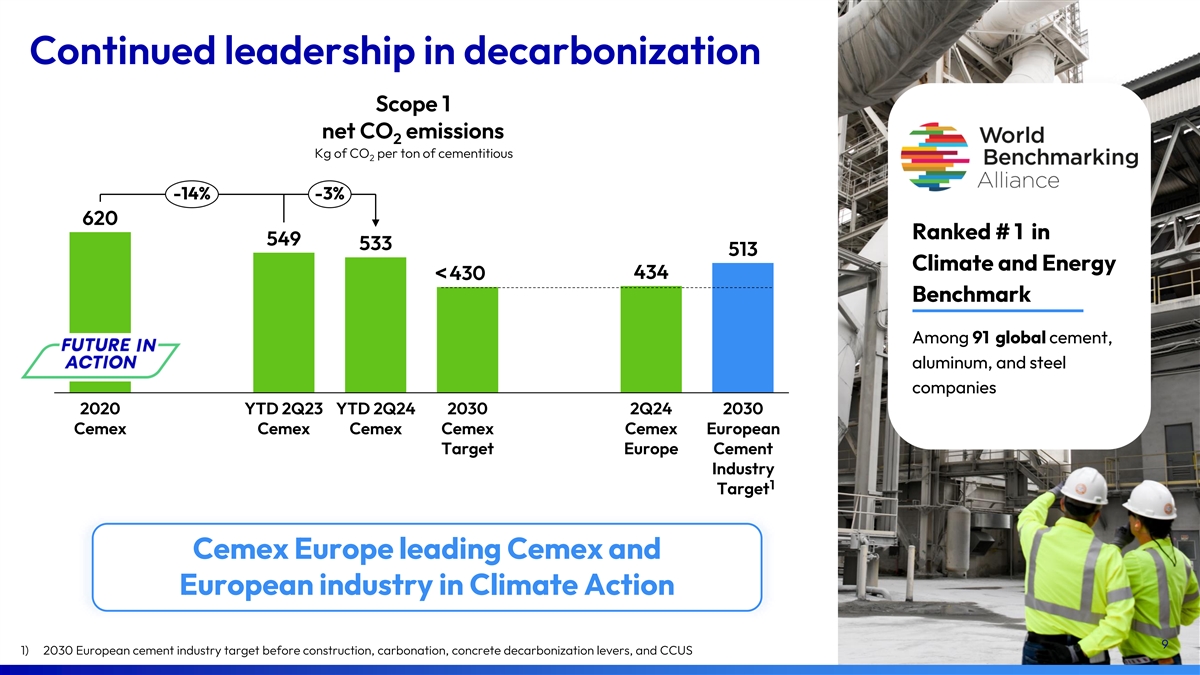
年初至今相關可持續發展指標客户和供應商 2023 年第二季度 24 年第二季度碳戰略 2023 年第二季度第二季度淨推薦值(NPS)68 70 75 533 千克二氧化碳 549 541 使用 CX Go 佔銷售額的 2% 65% 67% 65% 替代燃料(%)36.5% 36.3% 年初至今 73.4% 72.3% 72.3% 72.2% 熟料係數 低碳產品 2023 年健康與安全 2023 年第二季度第二季度 23 年第二季度混合水泥佔總數 2 3 0 員工死亡人數的百分比 81% 81% 81% 81% 81% 水泥生產員工 L-t-i 頻率 0.5 0.6 0.6 Vertua 混凝土佔總數 46% 48% 56% 運營 死亡人數為零 ,98% 96% 97% 受傷 (%) Vertua 水泥佔總數的百分比 55% 56% 62% 28
定義 SCAC 南部、中美洲和加勒比地區 EMEA 歐洲、 中東和非洲 MEA 中東和非洲在提供水泥產量變化時,是指國內灰水泥業務(從 2010 年第二季度開始,報告的水泥產量的基準將水泥從包括熟料 的國內水泥總量改為國產灰水泥)LC 當地貨幣 l-t-l(點贊)根據貨幣波動和投資情況進行調整/按類比調整在適用的情況下撤資為確保公司的 而產生的投資運營連續性。其中包括更換維護資本、過時資產或維持當前運營水平所需的項目的資本支出,以及強制性資本支出,這些項目必須遵守 政府支出法規或公司政策。當涉及應報告的細分市場銷售時,收入在取消集團內部交易之前列報。當提及合併銷售額時,它們代表財務報表中報告的公司總收入(淨銷售額)。息税折舊攤銷前利潤是指營業息税折舊攤銷前利潤:扣除其他費用、淨額加上折舊和營業攤銷前利潤率是指營業息税折舊攤銷前利潤率: 通過將我們的 “營業息税折舊攤銷前利潤” 除以銷售額計算得出 Cemex 將其定義為運營息税折舊攤銷前利潤減去淨利息支出、營運資金變動、已付税款和 其他現金項目(淨其他費用減去收益)來自處置已不在的過時和/或已嚴重耗盡的運營固定資產永續票據的運營和息票支付)國際財務報告準則國際財務報告準則 標準,由國際會計準則委員會發布的 Pp 百分點價格。所有提及定價舉措、價格上漲或下跌的內容,均指我們的產品價格戰略資本支出投資 以提高公司盈利能力為目的而發生的投資 。其中包括旨在通過擴大產能提高盈利能力的項目的資本支出,以及利潤率改善資本支出,這些項目 旨在通過降低成本來提高盈利能力(美元/美元)去年同期的同比百分比變化百分比 29

聯繫信息投資者關係美國股票信息 各州:紐約證券交易所(ADS):+1 877 7CX 墨西哥紐約證券交易所 CX:墨西哥證券交易所 +52 81 8888 4292(CPO):CEMEX.CPO ir@cemex.com CPO CPO 與 ADS 的比例:10 比 1
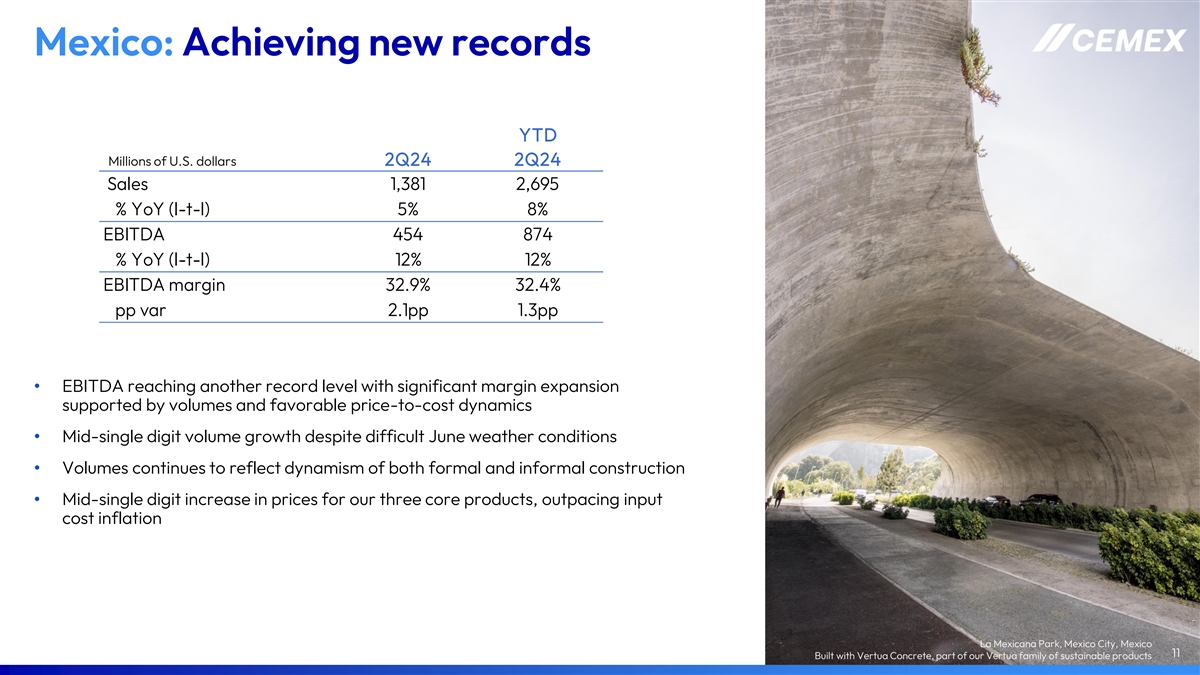
Mexico: Achieving new records YTD Millions of U.S. dollars 2Q24 2Q24 Sales 1,381 2,695 % YoY (l-t-l) 5% 8% EBITDA 454 874 % YoY (l-t-l) 12% 12% EBITDA margin 32.9% 32.4% pp var 2.1pp 1.3pp • EBITDA reaching another record level with significant margin expansion supported by volumes and favorable price-to-cost dynamics • Mid-single digit volume growth despite difficult June weather conditions • Volumes continues to reflect dynamism of both formal and informal construction • Mid-single digit increase in prices for our three core products, outpacing input cost inflation La Mexicana Park, Mexico City, Mexico 11 Built with Vertua Concrete, part of our Vertua family of sustainable products
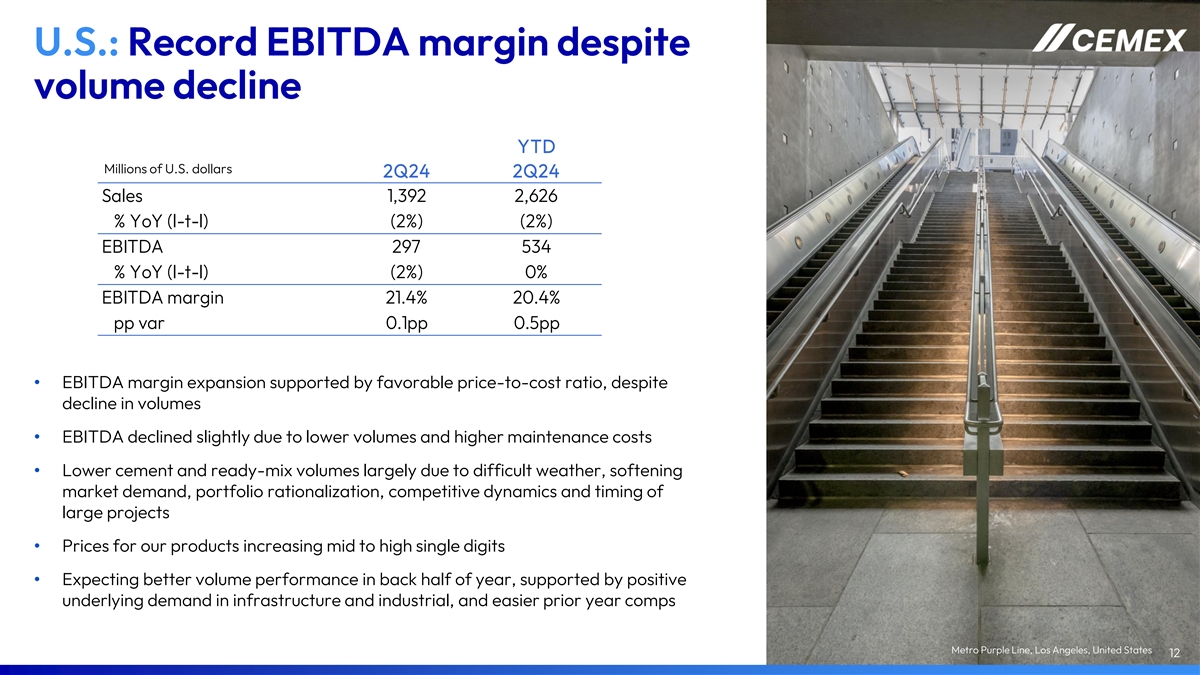
U.S.: Record EBITDA margin despite volume decline YTD Millions of U.S. dollars 2Q24 2Q24 Sales 1,392 2,626 % YoY (l-t-l) (2%) (2%) EBITDA 297 534 % YoY (l-t-l) (2%) 0% EBITDA margin 21.4% 20.4% pp var 0.1pp 0.5pp • EBITDA margin expansion supported by favorable price-to-cost ratio, despite decline in volumes • EBITDA declined slightly due to lower volumes and higher maintenance costs • Lower cement and ready-mix volumes largely due to difficult weather, softening market demand, portfolio rationalization, competitive dynamics and timing of large projects • Prices for our products increasing mid to high single digits • Expecting better volume performance in back half of year, supported by positive underlying demand in infrastructure and industrial, and easier prior year comps Metro Purple Line, Los Angeles, United States 12
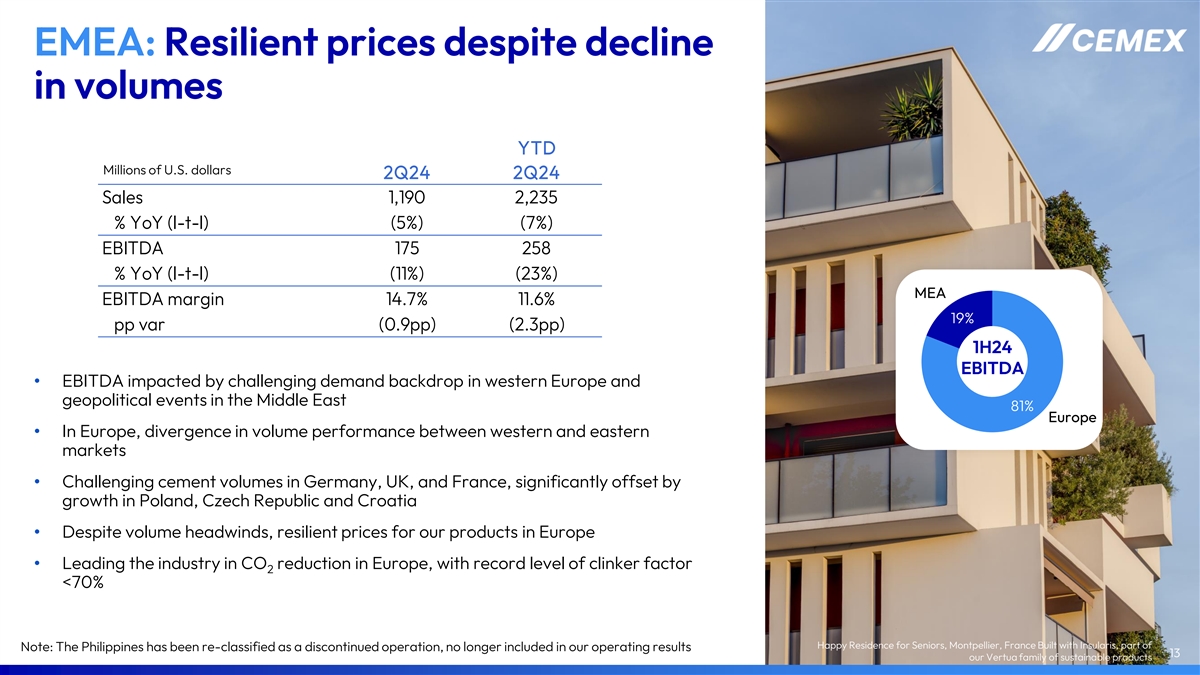
EMEA: Resilient prices despite decline in volumes YTD Millions of U.S. dollars 2Q24 2Q24 Sales 1,190 2,235 % YoY (l-t-l) (5%) (7%) EBITDA 175 258 % YoY (l-t-l) (11%) (23%) MEA EBITDA margin 14.7% 11.6% 19% pp var (0.9pp) (2.3pp) 1H24 EBITDA • EBITDA impacted by challenging demand backdrop in western Europe and geopolitical events in the Middle East 81% Europe • In Europe, divergence in volume performance between western and eastern markets • Challenging cement volumes in Germany, UK, and France, significantly offset by growth in Poland, Czech Republic and Croatia • Despite volume headwinds, resilient prices for our products in Europe • Leading the industry in CO reduction in Europe, with record level of clinker factor 2
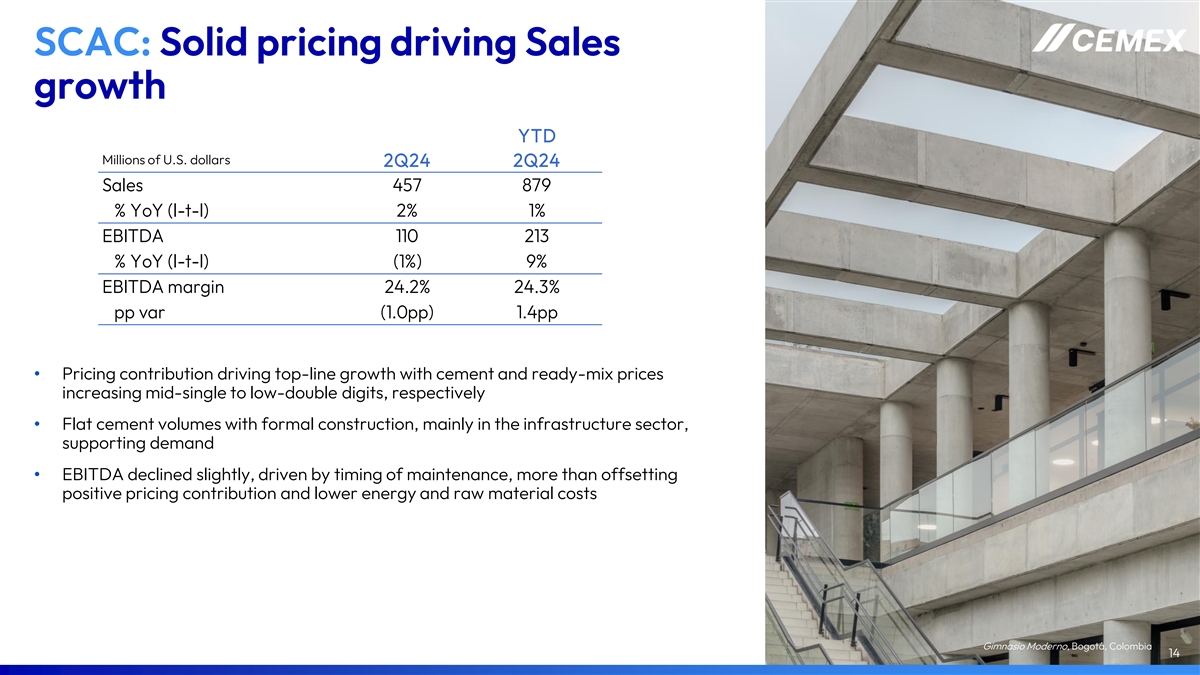
SCAC: Solid pricing driving Sales growth YTD Millions of U.S. dollars 2Q24 2Q24 Sales 457 879 % YoY (l-t-l) 2% 1% EBITDA 110 213 % YoY (l-t-l) (1%) 9% EBITDA margin 24.2% 24.3% pp var (1.0pp) 1.4pp • Pricing contribution driving top-line growth with cement and ready-mix prices increasing mid-single to low-double digits, respectively • Flat cement volumes with formal construction, mainly in the infrastructure sector, supporting demand • EBITDA declined slightly, driven by timing of maintenance, more than offsetting positive pricing contribution and lower energy and raw material costs Gimnasio Moderno, Bogotá, Colombia 14

Financial Developments Pelješac Bridge, Pelješac, Croatia Built with Vertua Concrete, part of our Vertua family of sustainable products
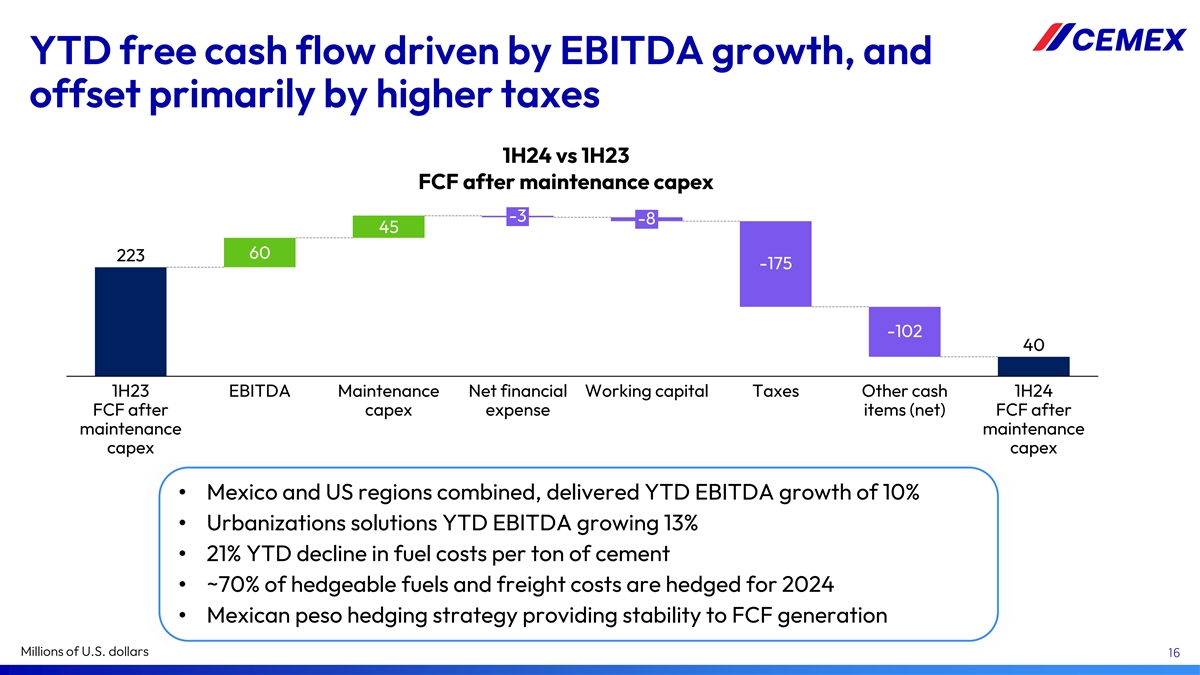
YTD free cash flow driven by EBITDA growth, and offset primarily by higher taxes 1H24 vs 1H23 FCF after maintenance capex -3 -8 45 60 223 -175 -102 40 1H23 EBITDA Maintenance Net financial Working capital Taxes Other cash 1H24 FCF after capex expense items (net) FCF after maintenance maintenance capex capex • Mexico and US regions combined, delivered YTD EBITDA growth of 10% • Urbanizations solutions YTD EBITDA growing 13% • 21% YTD decline in fuel costs per ton of cement • ~70% of hedgeable fuels and freight costs are hedged for 2024 • Mexican peso hedging strategy providing stability to FCF generation Millions of U.S. dollars 16

2024 Outlook Gilbert Chabroux School, Lyon, France Built with Insularis, part of our Vertua family of sustainable products
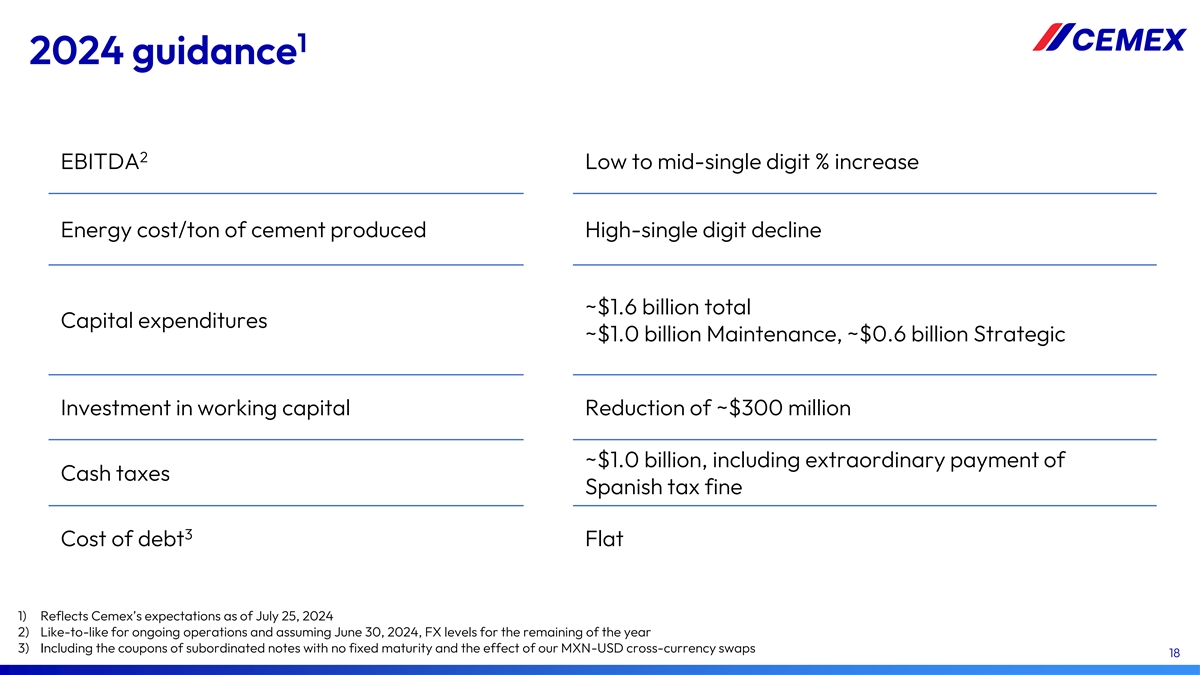
1 2024 guidance 2 EBITDA Low to mid-single digit % increase Energy cost/ton of cement produced High-single digit decline ~$1.6 billion total Capital expenditures ~$1.0 billion Maintenance, ~$0.6 billion Strategic Investment in working capital Reduction of ~$300 million ~$1.0 billion, including extraordinary payment of Cash taxes Spanish tax fine 3 Cost of debt Flat 1) Reflects Cemex’s expectations as of July 25, 2024 2) Like-to-like for ongoing operations and assuming June 30, 2024, FX levels for the remaining of the year 3) Including the coupons of subordinated notes with no fixed maturity and the effect of our MXN-USD cross-currency swaps 18

Appendix International Museum of Baroque, Puebla, Mexico
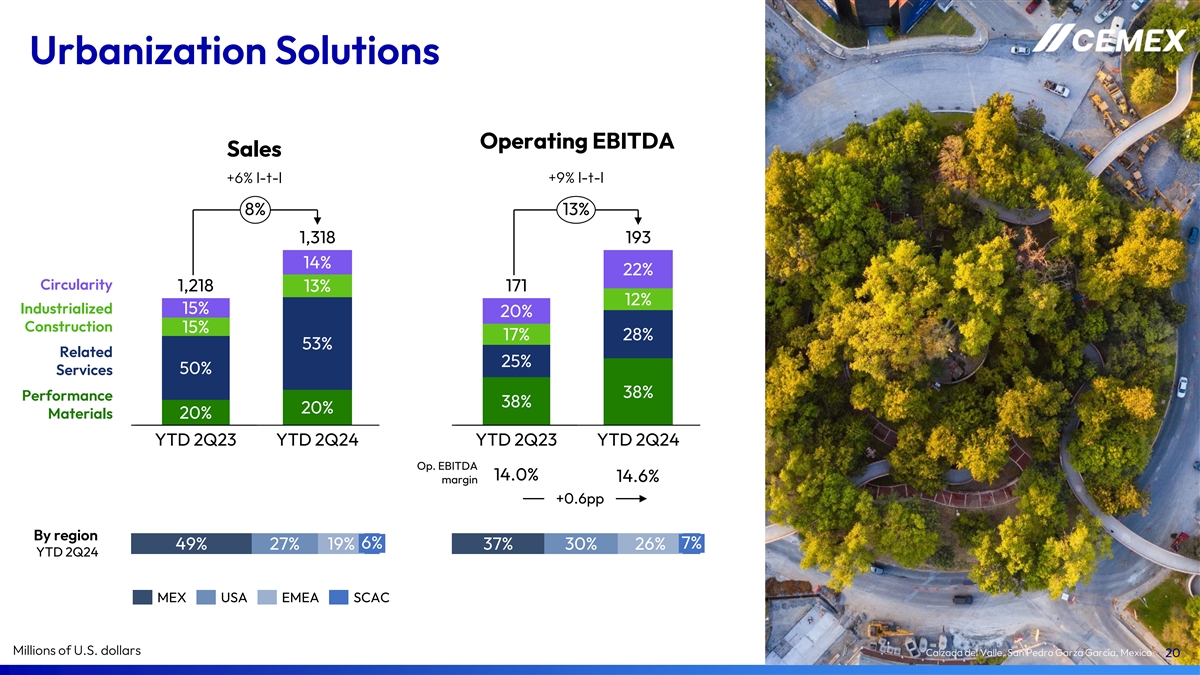
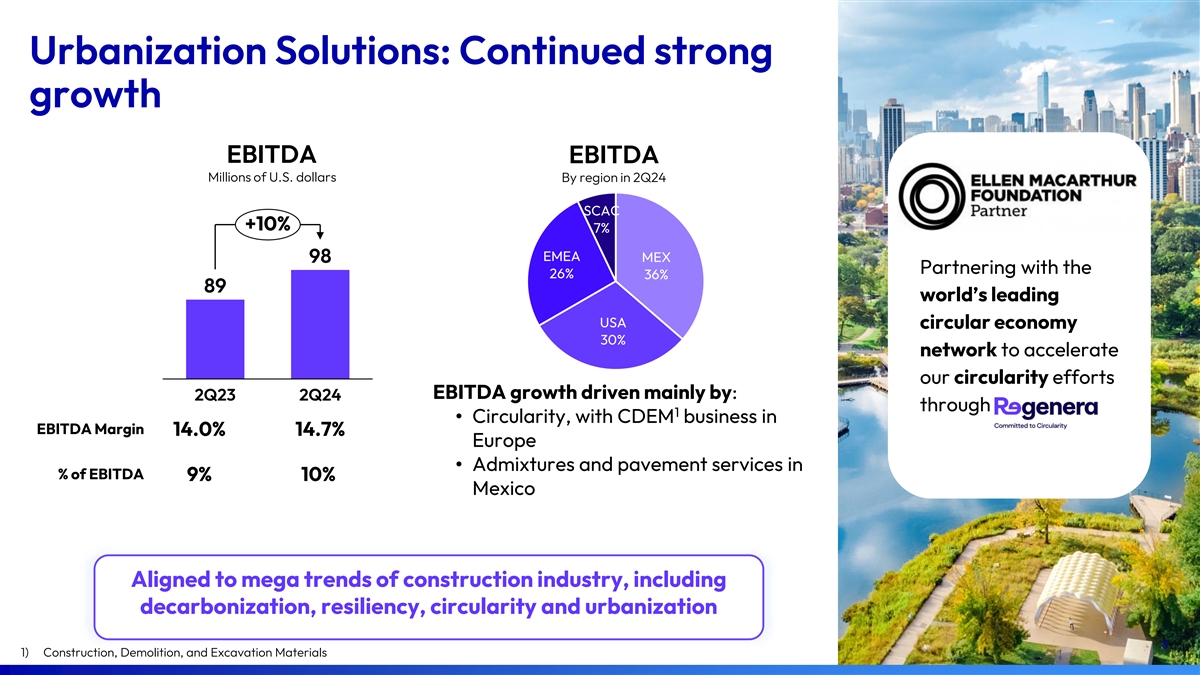
Urbanization Solutions Operating EBITDA Sales +9% l-t-l +6% l-t-l 8% 13% 1,318 193 14% 22% Circularity 1,218 171 13% 12% Industrialized 15% 20% Construction 15% 17% 28% 53% Related 25% 50% Services 38% Performance 38% 20% Materials 20% YTD 2Q23 YTD 2Q24 YTD 2Q23 YTD 2Q24 Op. EBITDA 14.0% 14.6% margin +0.6pp By region 6% 7% 49% 27% 19% 37% 30% 26% YTD 2Q24 MEX USA EMEA SCAC Millions of U.S. dollars Calzada del Valle, San Pedro Garza García, Mexico 20
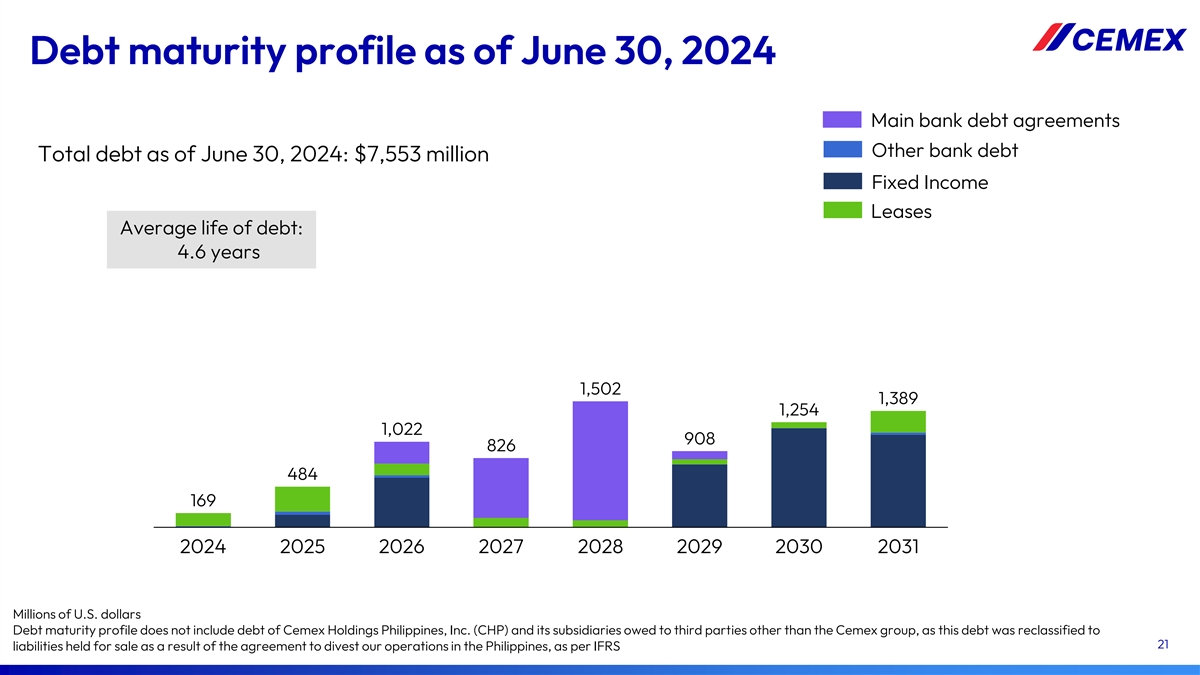
Debt maturity profile as of June 30, 2024 Main bank debt agreements Other bank debt Total debt as of June 30, 2024: $7,553 million Fixed Income Leases Average life of debt: 4.6 years 1,502 1,389 1,254 1,022 908 826 484 169 2024 2025 2026 2027 2028 2029 2030 2031 Millions of U.S. dollars Debt maturity profile does not include debt of Cemex Holdings Philippines, Inc. (CHP) and its subsidiaries owed to third parties other than the Cemex group, as this debt was reclassified to 21 liabilities held for sale as a result of the agreement to divest our operations in the Philippines, as per IFRS
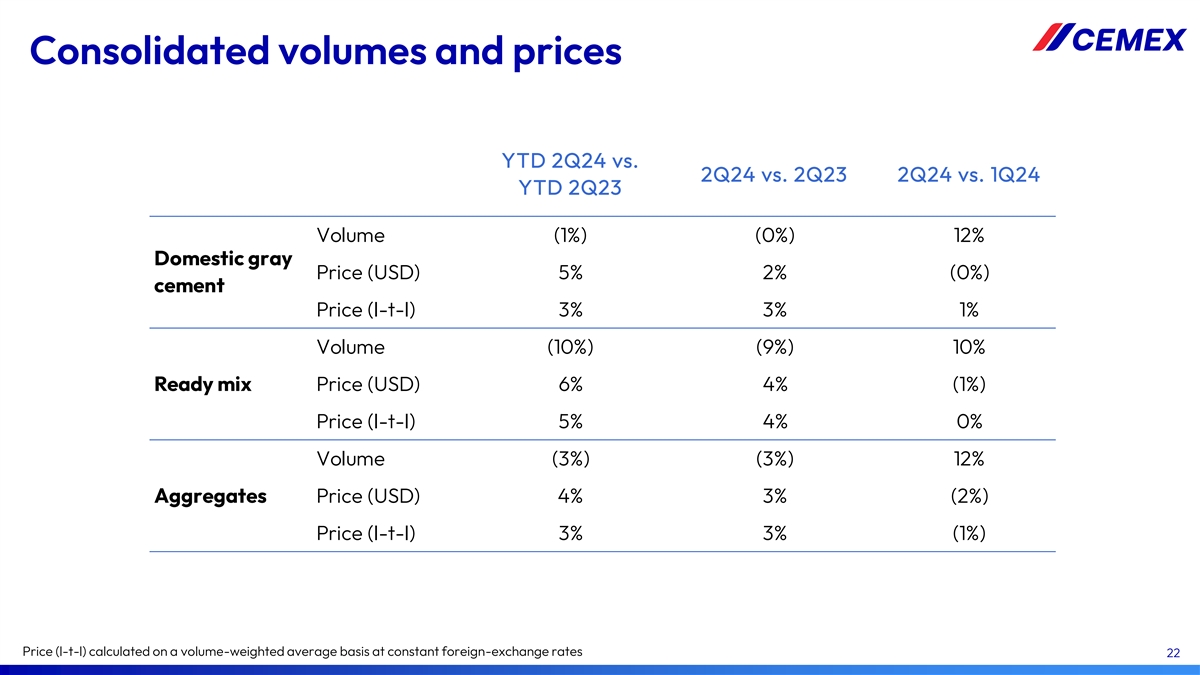
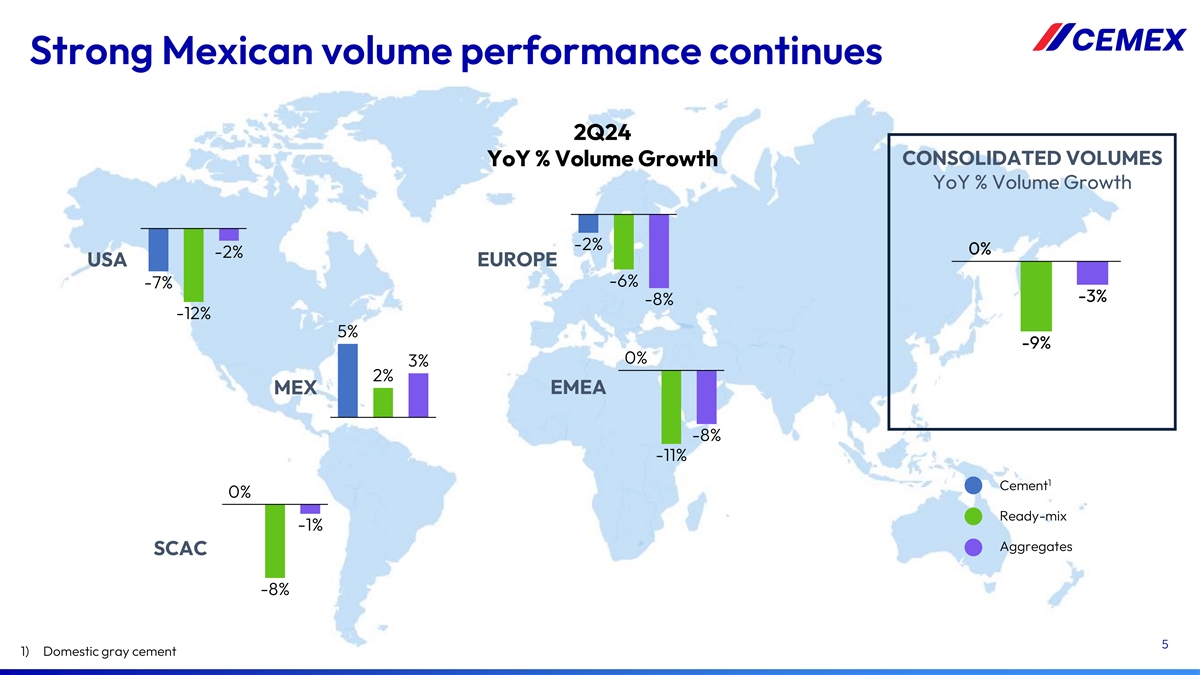
Consolidated volumes and prices YTD 2Q24 vs. 2Q24 vs. 2Q23 2Q24 vs. 1Q24 YTD 2Q23 Volume (1%) (0%) 12% Domestic gray Price (USD) 5% 2% (0%) cement Price (l-t-l) 3% 3% 1% Volume (10%) (9%) 10% Ready mix Price (USD) 6% 4% (1%) Price (l-t-l) 5% 4% 0% Volume (3%) (3%) 12% Aggregates Price (USD) 4% 3% (2%) Price (l-t-l) 3% 3% (1%) Price (l-t-l) calculated on a volume-weighted average basis at constant foreign-exchange rates 22
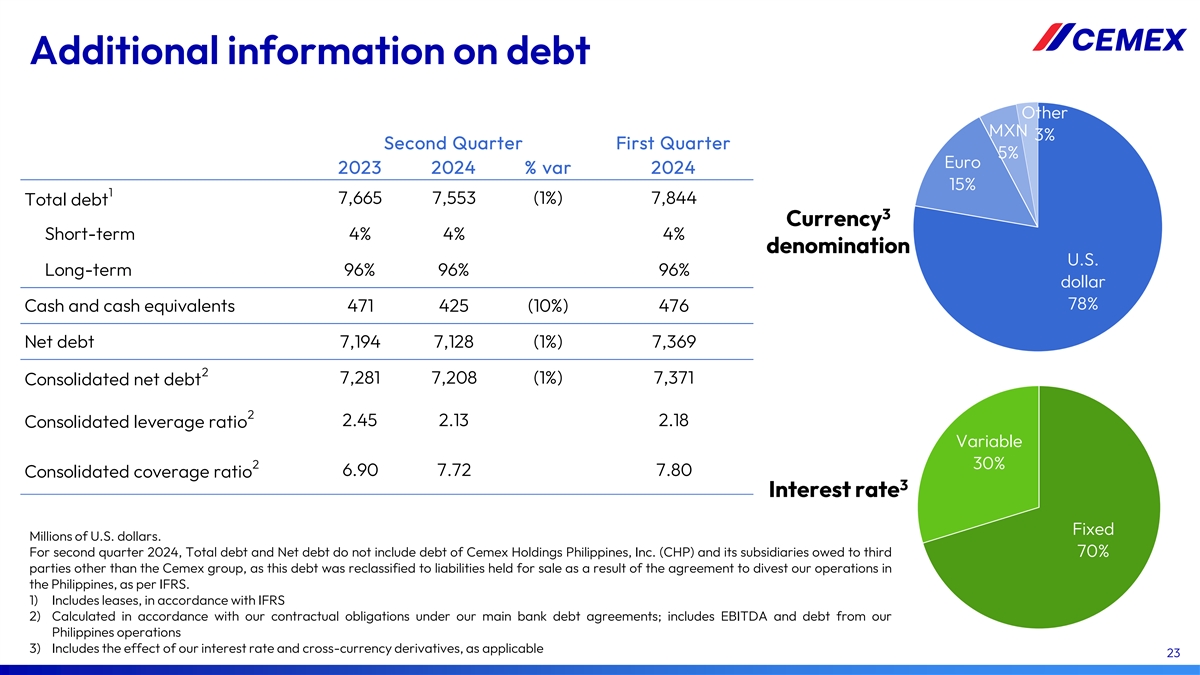
Additional information on debt Other MXN 3% Second Quarter First Quarter 5% Euro 2023 2024 % var 2024 15% 1 7,665 7,553 (1%) 7,844 Total debt 3 Currency Short-term 4% 4% 4% denomination U.S. Long-term 96% 96% 96% dollar 78% Cash and cash equivalents 471 425 (10%) 476 Net debt 7,194 7,128 (1%) 7,369 2 7,281 7,208 (1%) 7,371 Consolidated net debt 2 2.45 2.13 2.18 Consolidated leverage ratio Variable 2 30% 6.90 7.72 7.80 Consolidated coverage ratio 3 Interest rate Fixed Millions of U.S. dollars. For second quarter 2024, Total debt and Net debt do not include debt of Cemex Holdings Philippines, Inc. (CHP) and its subsidiaries owed to third 70% parties other than the Cemex group, as this debt was reclassified to liabilities held for sale as a result of the agreement to divest our operations in the Philippines, as per IFRS. 1) Includes leases, in accordance with IFRS 2) Calculated in accordance with our contractual obligations under our main bank debt agreements; includes EBITDA and debt from our Philippines operations 3) Includes the effect of our interest rate and cross-currency derivatives, as applicable 23
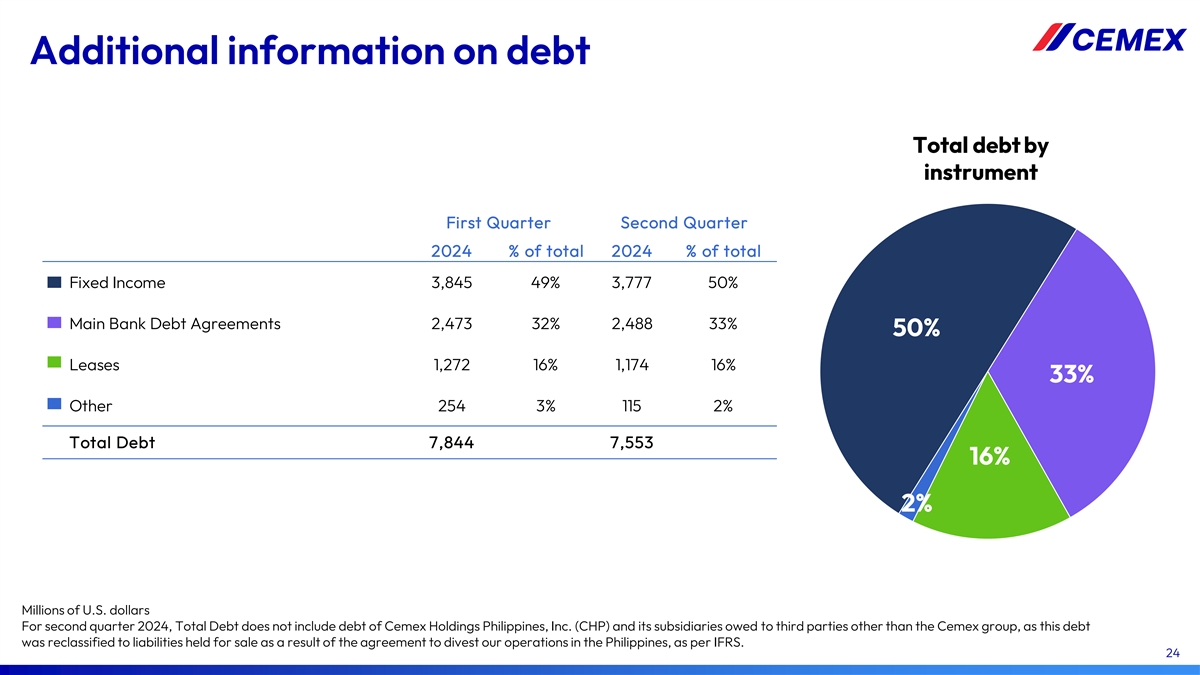
Additional information on debt Total debt by instrument First Quarter Second Quarter 2024 % of total 2024 % of total Fixed Income 3,845 49% 3,777 50% Main Bank Debt Agreements 2,473 32% 2,488 33% 50% Leases 1,272 16% 1,174 16% 33% Other 254 3% 115 2% Total Debt 7,844 7,553 16% 2% Millions of U.S. dollars For second quarter 2024, Total Debt does not include debt of Cemex Holdings Philippines, Inc. (CHP) and its subsidiaries owed to third parties other than the Cemex group, as this debt was reclassified to liabilities held for sale as a result of the agreement to divest our operations in the Philippines, as per IFRS. 24
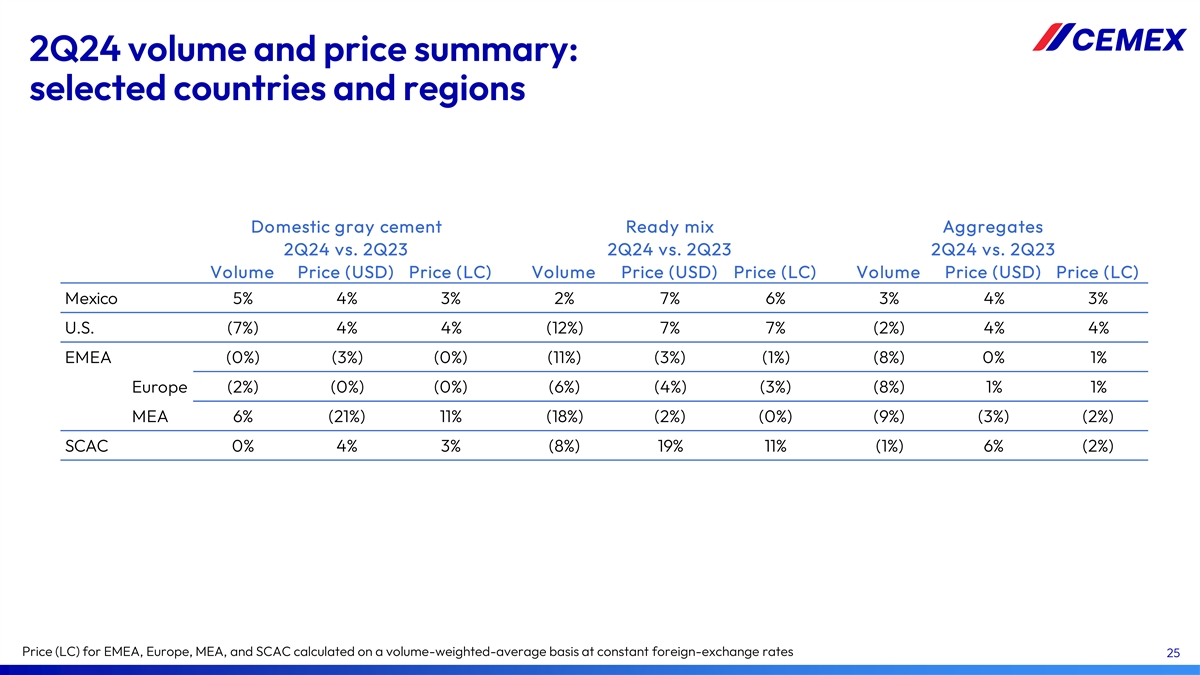
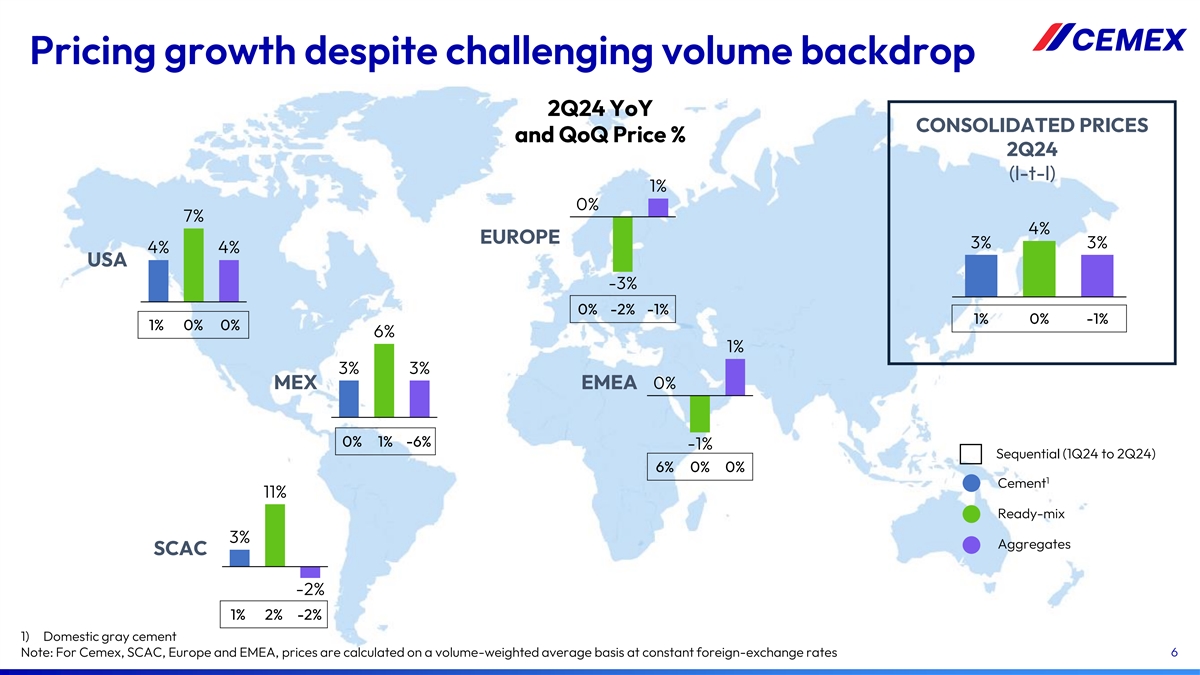
2Q24 volume and price summary: selected countries and regions Domestic gray cement Ready mix Aggregates 2Q24 vs. 2Q23 2Q24 vs. 2Q23 2Q24 vs. 2Q23 Volume Price (USD) Price (LC) Volume Price (USD) Price (LC) Volume Price (USD) Price (LC) Mexico 5% 4% 3% 2% 7% 6% 3% 4% 3% U.S. (7%) 4% 4% (12%) 7% 7% (2%) 4% 4% EMEA (0%) (3%) (0%) (11%) (3%) (1%) (8%) 0% 1% Europe (2%) (0%) (0%) (6%) (4%) (3%) (8%) 1% 1% MEA 6% (21%) 11% (18%) (2%) (0%) (9%) (3%) (2%) SCAC 0% 4% 3% (8%) 19% 11% (1%) 6% (2%) Price (LC) for EMEA, Europe, MEA, and SCAC calculated on a volume-weighted-average basis at constant foreign-exchange rates 25
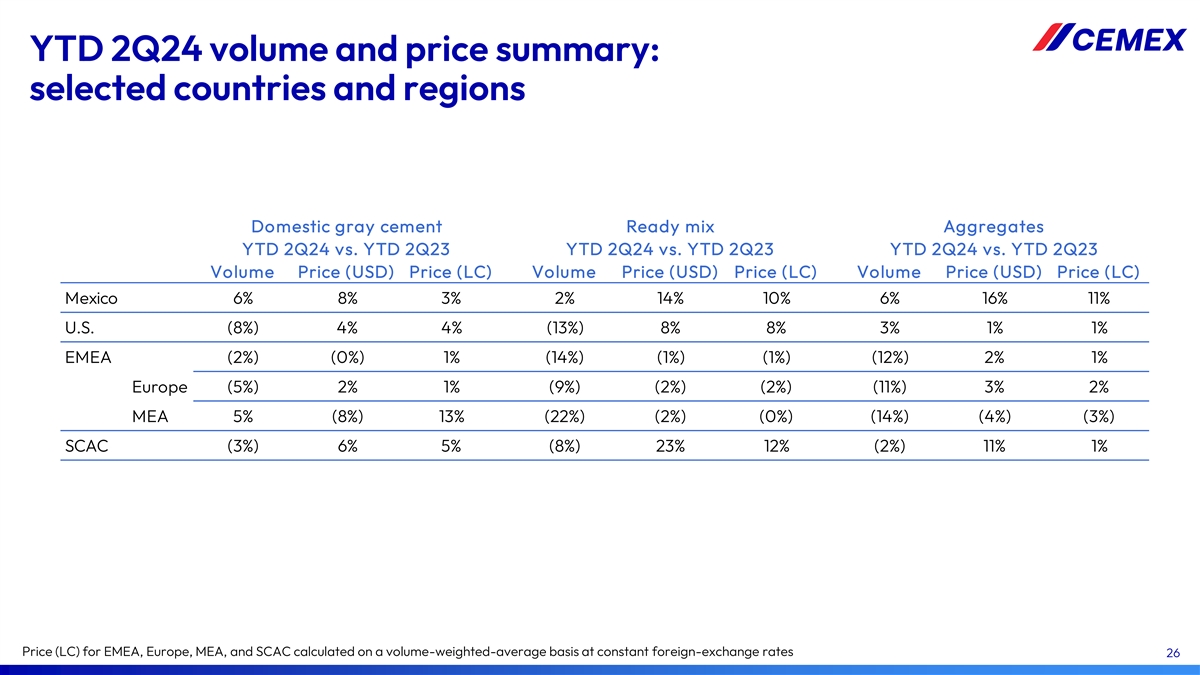
YTD 2Q24 volume and price summary: selected countries and regions Domestic gray cement Ready mix Aggregates YTD 2Q24 vs. YTD 2Q23 YTD 2Q24 vs. YTD 2Q23 YTD 2Q24 vs. YTD 2Q23 Volume Price (USD) Price (LC) Volume Price (USD) Price (LC) Volume Price (USD) Price (LC) Mexico 6% 8% 3% 2% 14% 10% 6% 16% 11% U.S. (8%) 4% 4% (13%) 8% 8% 3% 1% 1% EMEA (2%) (0%) 1% (14%) (1%) (1%) (12%) 2% 1% Europe (5%) 2% 1% (9%) (2%) (2%) (11%) 3% 2% MEA 5% (8%) 13% (22%) (2%) (0%) (14%) (4%) (3%) SCAC (3%) 6% 5% (8%) 23% 12% (2%) 11% 1% Price (LC) for EMEA, Europe, MEA, and SCAC calculated on a volume-weighted-average basis at constant foreign-exchange rates 26
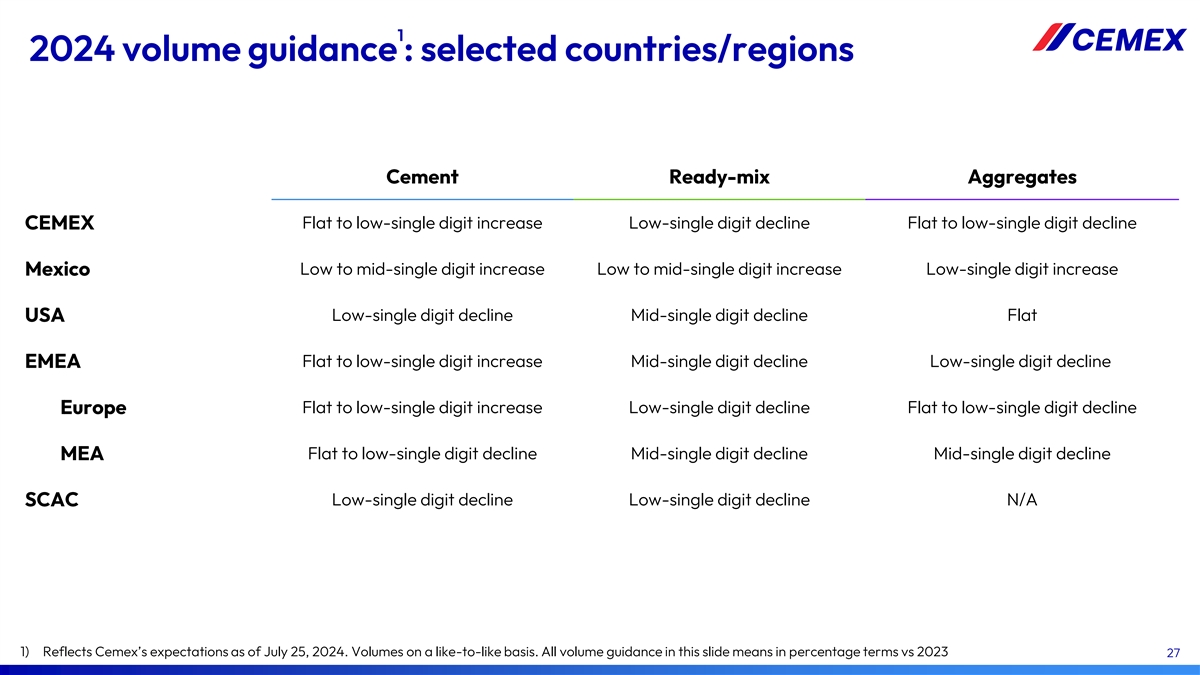
1 2024 volume guidance : selected countries/regions Cement Ready-mix Aggregates Flat to low-single digit increase Low-single digit decline Flat to low-single digit decline CEMEX Low to mid-single digit increase Low to mid-single digit increase Low-single digit increase Mexico Low-single digit decline Mid-single digit decline Flat USA Flat to low-single digit increase Mid-single digit decline Low-single digit decline EMEA Europe Flat to low-single digit increase Low-single digit decline Flat to low-single digit decline MEA Flat to low-single digit decline Mid-single digit decline Mid-single digit decline SCAC Low-single digit decline Low-single digit decline N/A 1) Reflects Cemex’s expectations as of July 25, 2024. Volumes on a like-to-like basis. All volume guidance in this slide means in percentage terms vs 2023 27
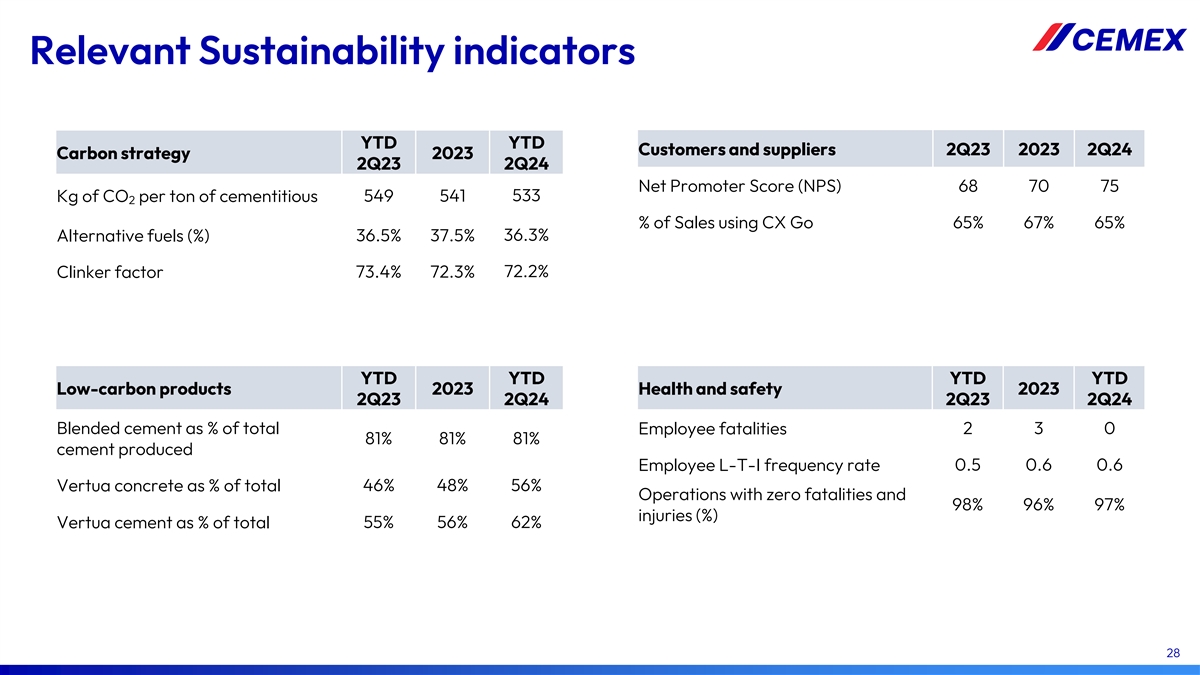
Relevant Sustainability indicators YTD YTD Customers and suppliers 2Q23 2023 2Q24 Carbon strategy 2023 2Q23 2Q24 Net Promoter Score (NPS) 68 70 75 533 Kg of CO per ton of cementitious 549 541 2 % of Sales using CX Go 65% 67% 65% Alternative fuels (%) 36.5% 37.5% 36.3% 73.4% 72.3% 72.2% Clinker factor YTD YTD YTD YTD Low-carbon products 2023 Health and safety 2023 2Q23 2Q24 2Q23 2Q24 Blended cement as % of total 2 3 0 Employee fatalities 81% 81% 81% cement produced Employee L-T-I frequency rate 0.5 0.6 0.6 Vertua concrete as % of total 46% 48% 56% Operations with zero fatalities and 98% 96% 97% injuries (%) Vertua cement as % of total 55% 56% 62% 28
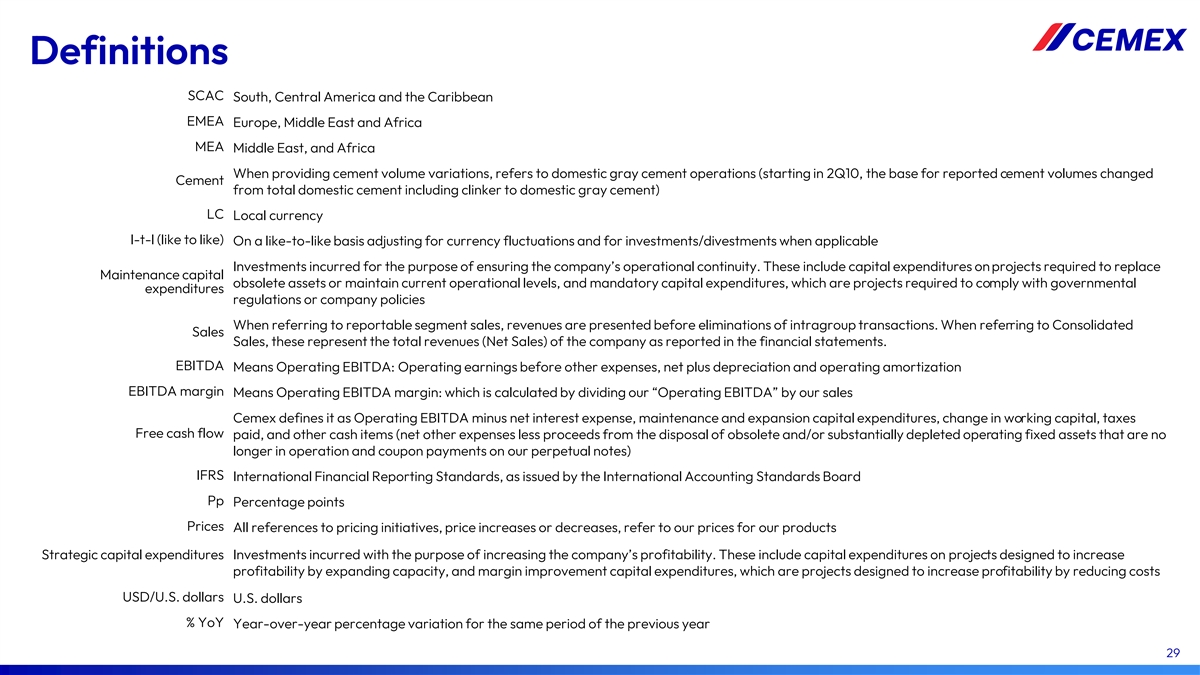
Definitions SCAC South, Central America and the Caribbean EMEA Europe, Middle East and Africa MEA Middle East, and Africa When providing cement volume variations, refers to domestic gray cement operations (starting in 2Q10, the base for reported cement volumes changed Cement from total domestic cement including clinker to domestic gray cement) LC Local currency l-t-l (like to like) On a like-to-like basis adjusting for currency fluctuations and for investments/divestments when applicable Investments incurred for the purpose of ensuring the company’s operational continuity. These include capital expenditures on projects required to replace Maintenance capital obsolete assets or maintain current operational levels, and mandatory capital expenditures, which are projects required to comply with governmental expenditures regulations or company policies When referring to reportable segment sales, revenues are presented before eliminations of intragroup transactions. When referring to Consolidated Sales Sales, these represent the total revenues (Net Sales) of the company as reported in the financial statements. EBITDA Means Operating EBITDA: Operating earnings before other expenses, net plus depreciation and operating amortization EBITDA margin Means Operating EBITDA margin: which is calculated by dividing our “Operating EBITDA” by our sales Cemex defines it as Operating EBITDA minus net interest expense, maintenance and expansion capital expenditures, change in working capital, taxes Free cash flow paid, and other cash items (net other expenses less proceeds from the disposal of obsolete and/or substantially depleted operating fixed assets that are no longer in operation and coupon payments on our perpetual notes) IFRS International Financial Reporting Standards, as issued by the International Accounting Standards Board Pp Percentage points Prices All references to pricing initiatives, price increases or decreases, refer to our prices for our products Strategic capital expenditures Investments incurred with the purpose of increasing the company’s profitability. These include capital expenditures on projects designed to increase profitability by expanding capacity, and margin improvement capital expenditures, which are projects designed to increase profitability by reducing costs USD/U.S. dollars U.S. dollars % YoY Year-over-year percentage variation for the same period of the previous year 29
Contact Information Investors Relations Stock Information In the United States: NYSE (ADS): +1 877 7CX NYSE CX In Mexico: Mexican Stock Exchange +52 81 8888 4292 (CPO): CEMEX.CPO ir@cemex.com Ratio of CPO to ADS: 10 to 1