添付ファイル99.2アメリカ金融グループ投資家補足資料-2023年第4四半期アメリカ金融グループ会社本社大アメリカ保険グループビル301 E Fourth Streetシンシナティ、郵便番号:45202 513 579 6739
American Financial Group, Inc. Table of Contents - Investor Supplement - Fourth Quarter 2022 4 Section Page Table of Contents - Investor Supplement - Fourth Quarter 2022.................................................................................................................. 2 Financial Highlights....................................................................................................................................................................................... 3 Summary of Earnings.................................................................................................................................................................................... 4 Earnings Per Share Summary....................................................................................................................................................................... 5 Property and Casualty Insurance Segment Property and Casualty Insurance - Summary Underwriting Results (GAAP)................................................................................................ 6 Specialty - Underwriting Results (GAAP)....................................................................................................................................................... 7 Property and Transportation - Underwriting Results (GAAP)........................................................................................................................ 8 Specialty Casualty - Underwriting Results (GAAP)........................................................................................................................................ 9 Specialty Financial - Underwriting Results (GAAP)....................................................................................................................................... 10 Other Specialty - Underwriting Results (GAAP)............................................................................................................................................. 11 Annuity Segment Discontinued Annuity Operations.................................................................................................................................................................. 12 Consolidated Balance Sheet / Book Value / Debt Consolidated Balance Sheet......................................................................................................................................................................... 13 Book Value Per Share and Price / Book Summary....................................................................................................................................... 14 Capitalization................................................................................................................................................................................................. 15 Additional Supplemental Information............................................................................................................................................................. 16 Consolidated Investment Supplement Total Cash and Investments.......................................................................................................................................................................... 17 Net Investment Income From Continuing Operations.................................................................................................................................... 18 Alternative Investments - Continuing Operations.......................................................................................................................................... 19 Fixed Maturities - By Security Type - AFG Consolidated............................................................................................................................... 20 Appendix A. Fixed Maturities by Credit Rating & NAIC Designation by Type 12/31/2022............................................................................................ 21 B. Fixed Maturities by Credit Rating & NAIC Designation by Type 12/31/2021............................................................................................ 22 C. Corporate Securities by Credit Rating & NAIC Designation by Industry 12/31/2022............................................................................... 23 D. Corporate Securities by Credit Rating & NAIC Designation by Industry 12/31/2021............................................................................... 24 E. Asset-Backed Securities by Credit Rating & NAIC Designation by Collateral Type 12/31/2022.............................................................. 25 F. Asset-Backed Securities by Credit Rating & NAIC Designation by Collateral Type 12/31/2021.............................................................. 26 G. Real Estate-Related Investments 12/31/2022......................................................................................................................................... 27 H. Real Estate-Related Investments 12/31/2021.......................................................................................................................................... 28 Page 2
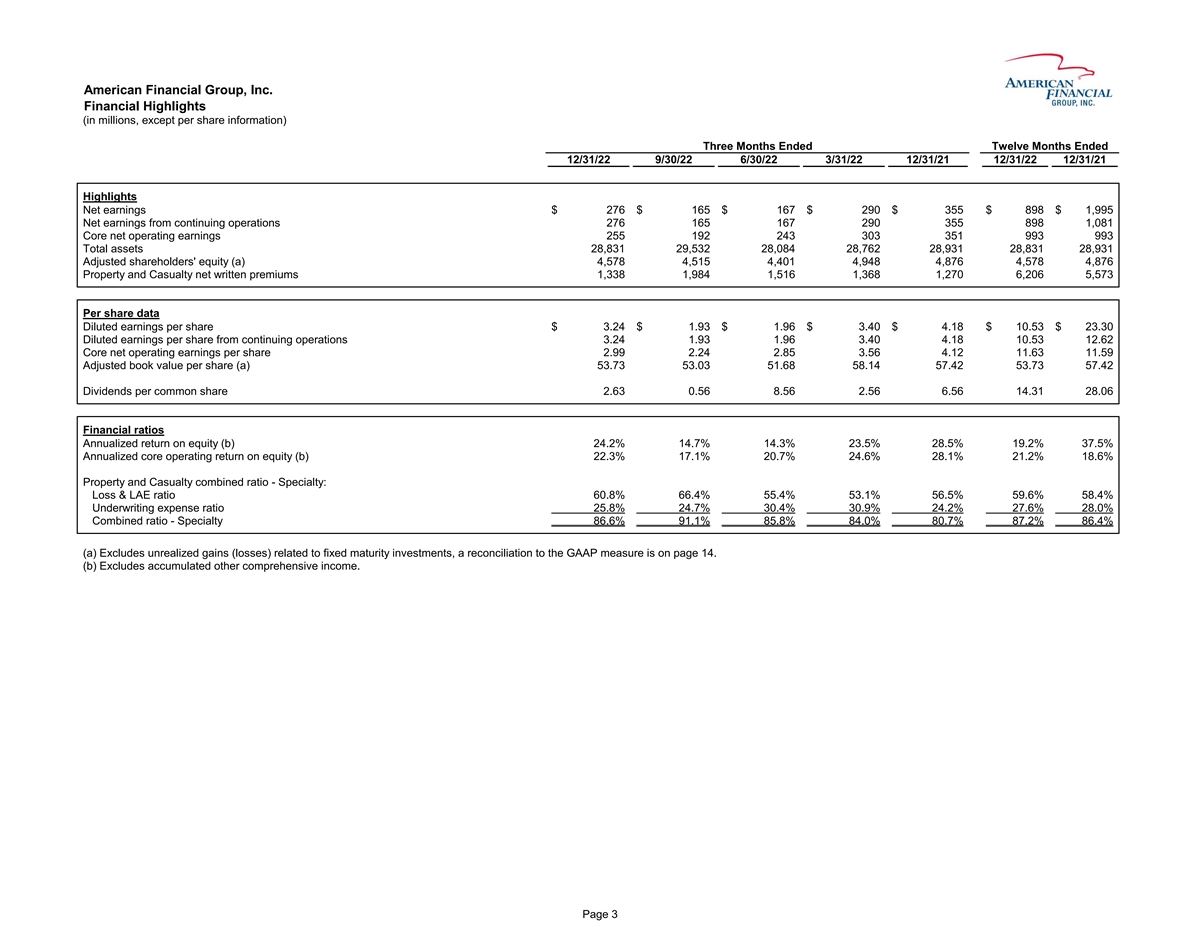
アメリカ金融グループ(American Financial Group,Inc.)財務のハイライト(単位:百万 1株当たり情報を除く)現在12/31/22 9/30/22 6/30/22 3/31/22 12/31/21 12/31/22 12/31/21重点純収益$276$165$167$290$355$898$1,995継続運営純収益276 165 167 290 355 898 1,081コア純運営収益255 192 243 3303 993 993総資産28,831 29,532 28,084 28,762,931 28,831 28,831 28,831 28,931,931調整後株主権益(A)4,54,515,976,848,8481,338 1,984 1,516 1,270 6,206 5,573 1株当たりの償却収益データ1株当たりの償却収益$3.24$1.93$1.96$3.40$4.18$10.53$23.30継続的に運営されている償却1株当たり収益3.24 1.93 1.96 3.40 4.18 10.53 12.62コア運営純収益 1株当たり収益2.99.24 2.85 3.56 4.12 11.59調整後の1株当たりの帳簿価値(A)53.73 53.03 51.68 58。14 57.42 53.73 57.42普通株主配当1株当たり2.63 0.56 8.56 2.56 6.56 14.31 28.06財務比率年化配当金収益率(B) 24.2%14.7%14.3%23.5%28.5%19.2%37.5%年化コア運営配当金収益率(B)22.3%17.1%20.7%24.6%28.1%21.2%18.6%財産と意外傷害総合比率--専門:損失率60.8%66.4%55.4%53.1%56.5%59.6%58.4% 保険費用比率25.8%24.7%30.4%30.9%24.2%27.6%28.0%合併比率-専門86.6%91.1%85.8%84.0%80.7%87.2%86.4%(A)固定期限投資に関する未実現収益(損失)は含まれていない。公認会計基準 計量に対する入金は14ページ目を参照。(B)累積された他の全面収入は含まれていない。3ページ目
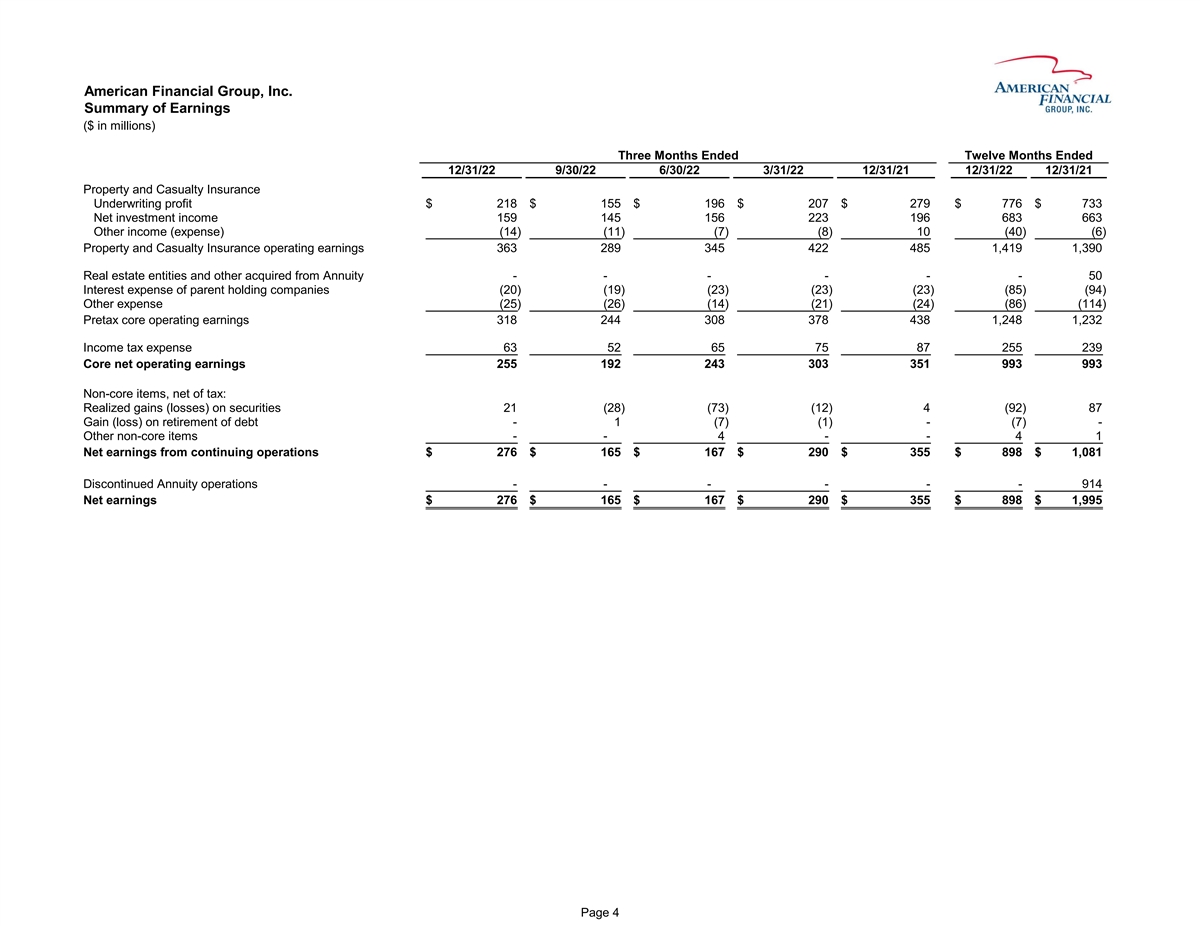
アメリカの金融グループは現在12/31/22 9/30/22 6/30/22 3/31/22 12/31/21 12/31/22 12/31/21財産および意外保険引受利益$218$155$196$207$776$733純投資収益159 145 223 196 683 663その他収入 (費用)(14)(11)(7)(8)10(40)(6)財産および意外保険営業収益363 289 345 422 485 1,419 1,390不動産実体と他の年金から得られた収益--50親会社持株会社の利息支出(20)(19) (23)(23)(23)(85)(94)その他支出(25)(26)(14)(21)(24)(86)(114)税前コア営業収益318 244 378 438 1,248 1,232所得税支出63 52 65 75 75 255 239コア営業純収益255 192243 303 351 993 993非コアプロジェクト、税引後純額:証券実現収益(損失)21(28)(73)(12)4(92)87債務償還収益(損失)−−1(7)(1)-(7)−その他非コアプロジェクト−4−−4 1経営継続純収益$276$165$167$290$355$898$1,081年金業務終了−−914純収益$276$165$167$290$355$898$1,995 4ページ
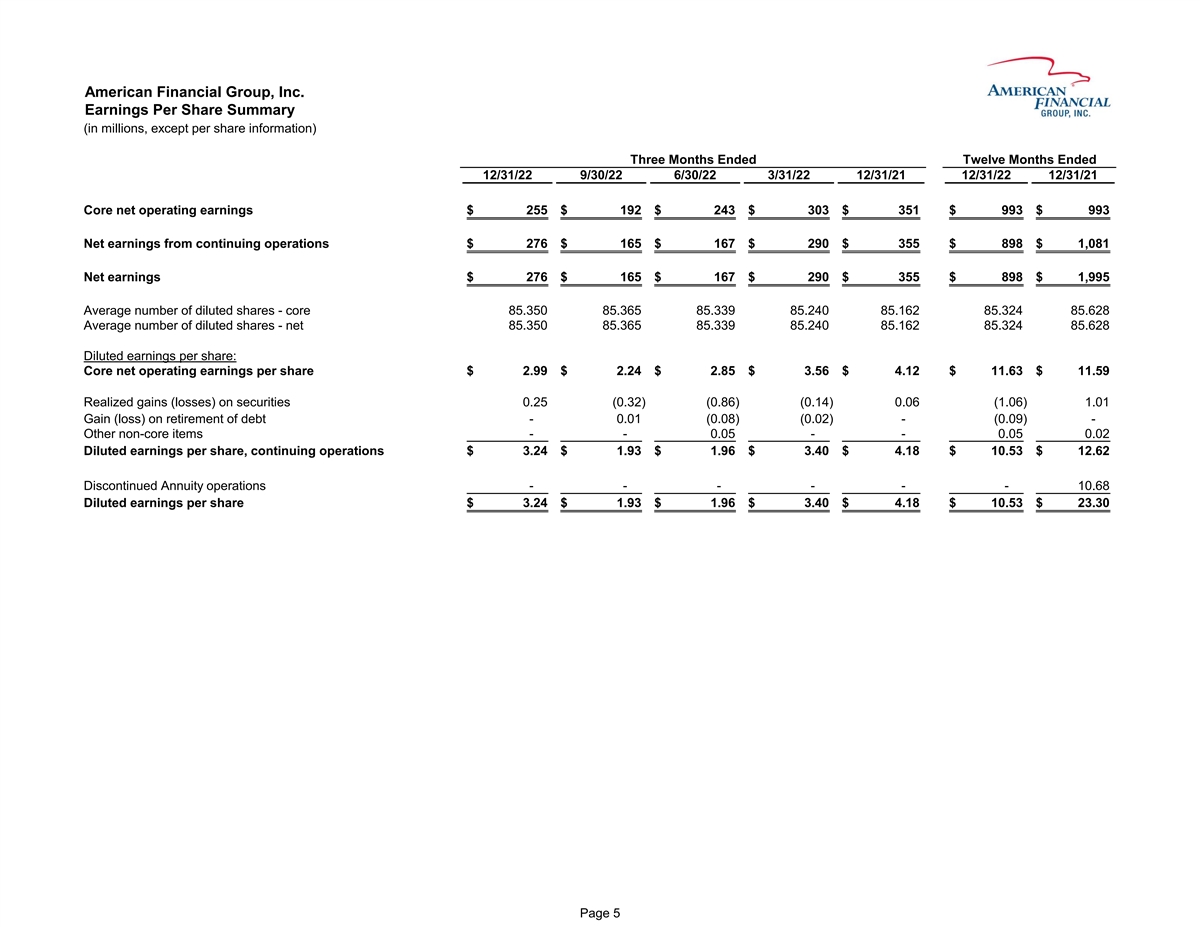
アメリカ金融グループ会社の1株当たり収益の概要(単位:百万(br}1株当たりの情報を除く)現在12/31/22 9/30/22 6/30/22 3/31/22 12/31/21 12/31/22 12/31/21コア純営業収益$255$192$243$303$351$993$993持続運営純収益$276$ 165$167$290$898$1,081純収益$276$165$167$290$355$898$1,995希釈後の株式平均-コア85.350 365 85.339 85.240 85.162 85.324 85.628希釈後の平均株式数-純85.350 365 85.339 85.240 85.240 85.324 85.628希釈後の1株当たり収益:1株当たりコア純営業収益$2.99$2.24$2.85$3.56$4.12$11.63$11.59証券が達成した収益(損失)0.250.32(0.86)(0.14)0.06(1.06)1.01収益(損失)債務返済-0.01(0.08)(0.02)-(0.09)--その他の非核心項目--0.05--0.05希釈後の1株当たり収益、持続業務$3.24$1.93$1.96$3.40$4.18$10.53$12.62非連続年金業務--10.68希釈後の1株当たり収益 $3.24$1.93$1.96$3.40$4.18$10.53$23.30 5ページ
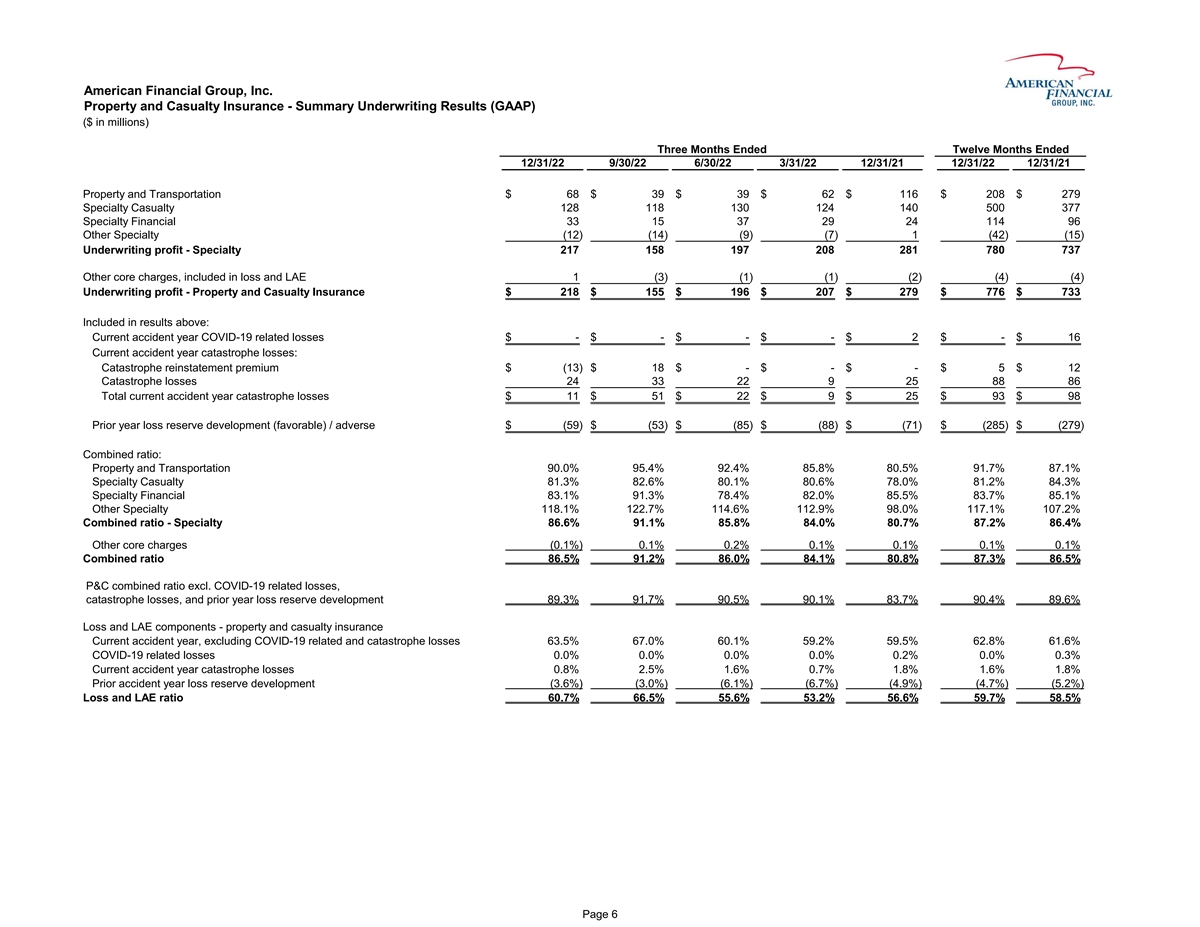
アメリカの金融グループは会社財産と傷害保険-概要 保証実績(GAAP)(百万ドル単位)現在12/31/22 9/30/22 6/22 3/31/22 12/31/21 12/31/22 12/31/21財産および輸送$68$39$39$62$116$208$279特殊傷害128 118 130 124 140 500 377特殊財務33 15 29 24 114 96その他特殊財務(12)(14)(9)(7)1(42)(15)引受利益-専門217 158 197 208 281 780 737他のコア料金、損失とLAE 1(3)(1)(1)(2)(4)(4)引受利益− 財産と傷害保険$218$155$196$207$279$776$733上記の結果に含まれる:本事故年の新冠肺炎関連損失$−$2−$16本事故年間の災害損失:巨大災害回復 保険料$(13)$18$−$5$12巨大被害24 33 22 9 25 88 86事故年巨大災害損失$11$51$22$9$25$93$98前年損失準備金発展(有利)/不利$(59)$(53)$(85)$(88)$ (71)$(285)$(279)総合比率:財産と輸送90.0%95.4%95.4%85.8%80.5%91.7%87.1%特殊死傷81.3%82.6%80.01%78.0%81.2%84.3%専門財務83.1%91.3%78.4%82.0%85.5%83.7%85.1%その他専門 118.1%122.7%114.6%112.9%98.0%117.1%107.2%合併比率-専門86.6%91.1%85.8%84.0%80.7%87.2%86.4%その他コア費用(0.1%)0.1%0.1%0.1%0.1%0.1%合併比率86.5%91.2%86.0%84.1%80.8%87.3%86.5%P&C合併比率 を除外した。新冠肺炎関連損失、巨大災害損失と前年損失準備金発展89.3%91.7%90.5%90.1%83.7%90.4%89.6%損失と損失準備金構成要素-財産と傷害保険本年度, 新冠肺炎関連損失と巨災損失を含まない63.5%67.0%60.1%59.2%59.5%62.8%61.6%新冠肺炎関連損失0.0%0.0%0.2%0.0%0.3%現在事故年巨大災害損失0.8%2.5%1.6%0.7%1.8%前事故年損失準備金発展 (3.6%)(3.0%)(6.1%)(6.7%)(4.9%)(4.7%)損失とLAE比率60.7%66.5%55.6%53.2%56.6%59.7%58.5%6ページ
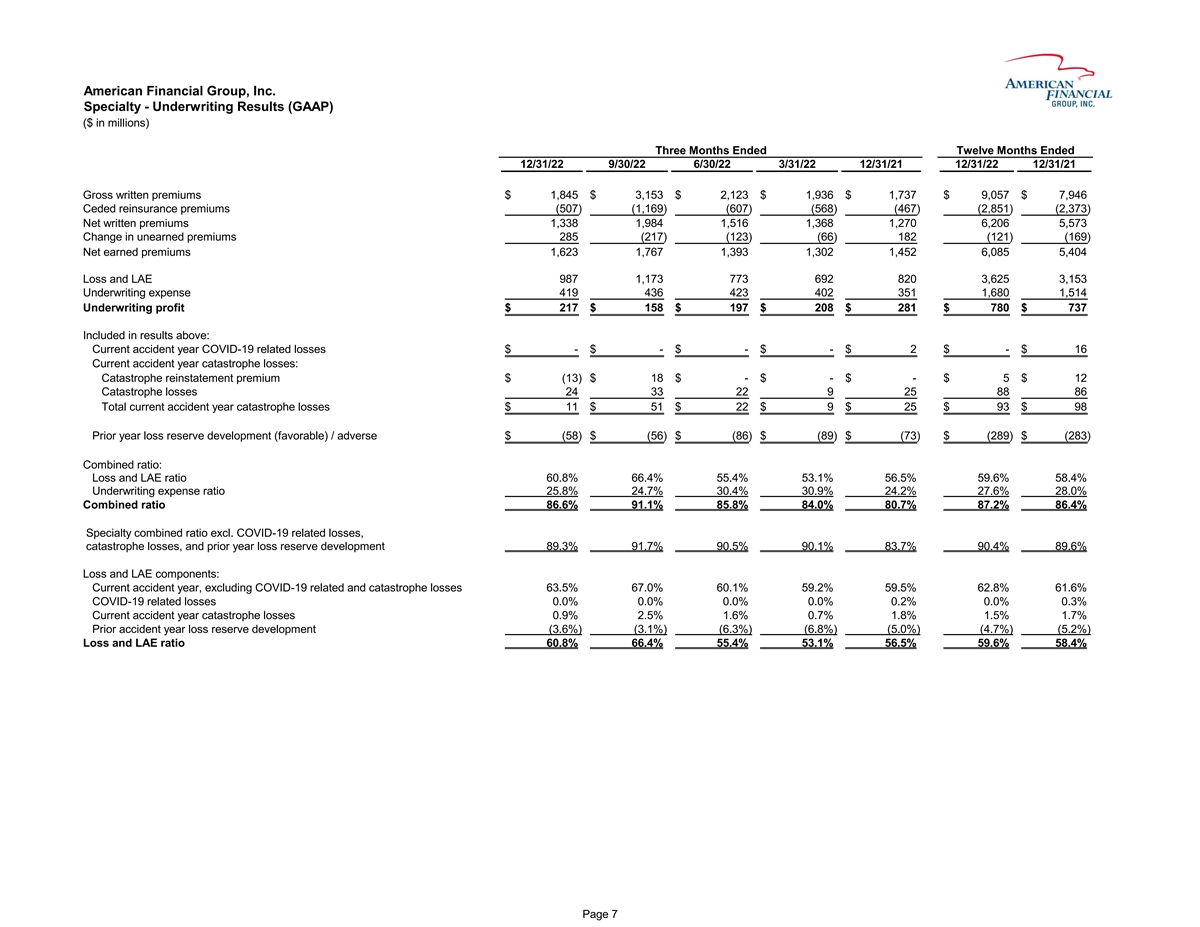
現在12/31/22 9/30/22 6/30/22 3/31/22 12/31/21 12/31/22 12/31/21毛保料$1,845$3,153$2,123$1,936$1,737$9,057$7,946(507)(1,169)(607)(568) (467)(2,851)(2,純保険料1,338 1,984 1,5161,368 1,270 6,206 5,573未稼ぎ保険料変動285(217)(123)(66)182(121)(169)純利益保険料1,623 1,767 1,3931,3021,4526,085 5,404損失およびLAE 9871,173 773 692 8203,625 3,153保険419 436 423 402 351 1,680 1,625514引受利益$217$158$197$208$281$780$737上記の結果に含まれています:本事故年の新冠肺炎関連損失$-$2-$16現在の意外 年の巨大災害損失:巨災回復保険料$(13)$18$-$-$5$12巨大被害24 33 22 9 25 88本年度合計本年巨大損失$11$51$22$9$25$93$98前年損失準備金発展 /不利$(58)$(56)$(86)$(89)$(73)$(289)$(283)連結比率:損失と貸借対照比率60.8%66.4%55.4%53.1%56.5%59.6%58.4%保険費用比率25.8%24.7%30.4%30.9%24.2%27.6%28.0%合併比率86.6%91.1% 85.8%84.0%80.7%87.2%86.4%専門業務比率を除く。新冠肺炎関連損失、巨大災害損失と前年損失準備金発展89.3%91.7%90.5%90.1%83.7%90.4%89.6%損失とLAE構成要素:現在の事故年, 新冠肺炎関連と巨大災害損失63.5%67.0%60.1%59.2%59.5%62.8%61.6%新冠肺炎関連損失0.0%0.0%0.2%0.0%0.3%現在の事故年巨大災害損失0.9%2.5%1.6%0.7%1.8%1.5%1.7%以前事故年損失準備金(3.6%)(3.1%)(6.3%)(6.8%)(5.0%)(4.7%)損失とLAE比率60.8%66.4%55.4%53.1%56.5%59.6%58.4%7ページ

米国金融グループ財産·運輸会社− 保険実績(百万ドル単位)現在12/31/22 9/30/22 6/30/22 3/31/22 12/31/22 12/31/21毛保険料$601$1,737$962$760$558$4,060$3,263再保険料放棄(178) (778)(330)(259)(141)(1,545)純保険料423 959 632 501 417 2,515 2,157未稼ぎ保険料変動259(102)(127)(58)180(28)(13)純利益保険料682 857 505 443 597 2,4872,144損失及びLAE 489 663 327 256 394 1,735 1394保険料125 155 139 125 87 544 471引受利益$68$39$62$116$208$279以上の結果は、本事故年の新冠肺炎関連損失$-$-現在の事故年の巨大災害 損失:巨大災害復旧保険料$(1)$4$-$-$3$9巨災損失8 9 19 6 15 42 49今年度合計意外災害損失$7$13$19$6$15$45$58前年損失準備金発展(有利)/不良資産$ (13)$(15)$(30)$(34)$(2)$(92)$(103)連結比率:赤字と貸借対照比率71.8%77.3%64.7%57.7%66.0%69.8%65.1%保険費用比率18.2%18.1%27.7%28.1%14.5%21.9%22.0%合併比率90.0%95.4%92.4%85.8%80.5%91.7%87.1% 合併比率(含まない)。新冠肺炎関連損失、巨大災害損失と前年損失準備金発展90.8%95.8%94.6%92.1%78.4%93.5%89.2%損失とLAE構成部分:現在事故年、新冠肺炎関連と巨大災害損失を含まない 72.6%77.7%66.9%64.0%63.9%71.6%67.2%新冠肺炎関連損失0.0%0.0%現在事故年巨災損失1.0%1.4%3.8%1.5%2.5%1.9%2.7%前事故年損失準備金発展(1.8%)(1.8%)(6.0%)(7.8%) (0.4%)(3.7%)損失とLAE比率71.8%77.3%64.7%57.7%66.0%69.8%65.1%8ページ

現在12/31/22 9/30/22 6/30/22 3/31/22 12/31/21 12/31/22 12/31/21毛保料$1,007$1,184$948$976$968$4,115$3,890割譲再保険料(352)(407)(302)(326) (340)(1,387)(1,純保険料655 777 646 650 628 2,728 2,540未稼ぎ保険料変動31(100)11(11)8(69)(132)稼いだ保険料純額686 677 657 639 636 2,659 2,408損失およびLAE 381 374 354 344 340 1,4531399引受費用177 185 173 171 156 706 632保険利益$128$118$130$124$140$500$377以上の結果を含む:本事故年の新冠肺炎関連損失$-$1-$9本事故年の巨大災害損失: 巨大災害復旧保険料$(1)$1$-$1巨大災害損失8 2-1 3 11 9本事故年の巨大損失総額$7$3$-$1$11$10前年損失準備金発展(有利)/不利な$(50)$(42)$ (49)$(49)$(55)$(190)$(140)総合比率:損失およびLAE比率55.4%55.3%53.9%53.8%53。5%54.7%58.1%保険費用比率25.9%27.3%26.2%26.8%24。5%26.5%26.2%合併比率81.3%82.6%80.1%80.6%78.0%81.2%84.3%合併比率 を除外した。新冠肺炎関連損失、巨大災害損失、前年損失準備金発展87.5%88.5%87.5%88.1%85。8%87.9%89.3%損失およびLAE組成:現在の事故年は、新冠肺炎に関連する損失および巨大災害損失61.6%61.2% 61.3%61.3%61を含まない。3%61.4%63.1%新冠肺炎関連損失0.0%0.0%0.0%0。2%0.0%0.4%現在の事故年の巨大災害損失1.1%0.4%0.1%0.1%0。5%0.5%0.4%以前事故年損失準備金発展(7.3%)(6.3%)(7.5%)(7.6%) (8.5%)(7.2%)(5.8%)損失とLAE比率55.4%55.3%53.9%53.8%53.5%54.7%58.1%9ページ
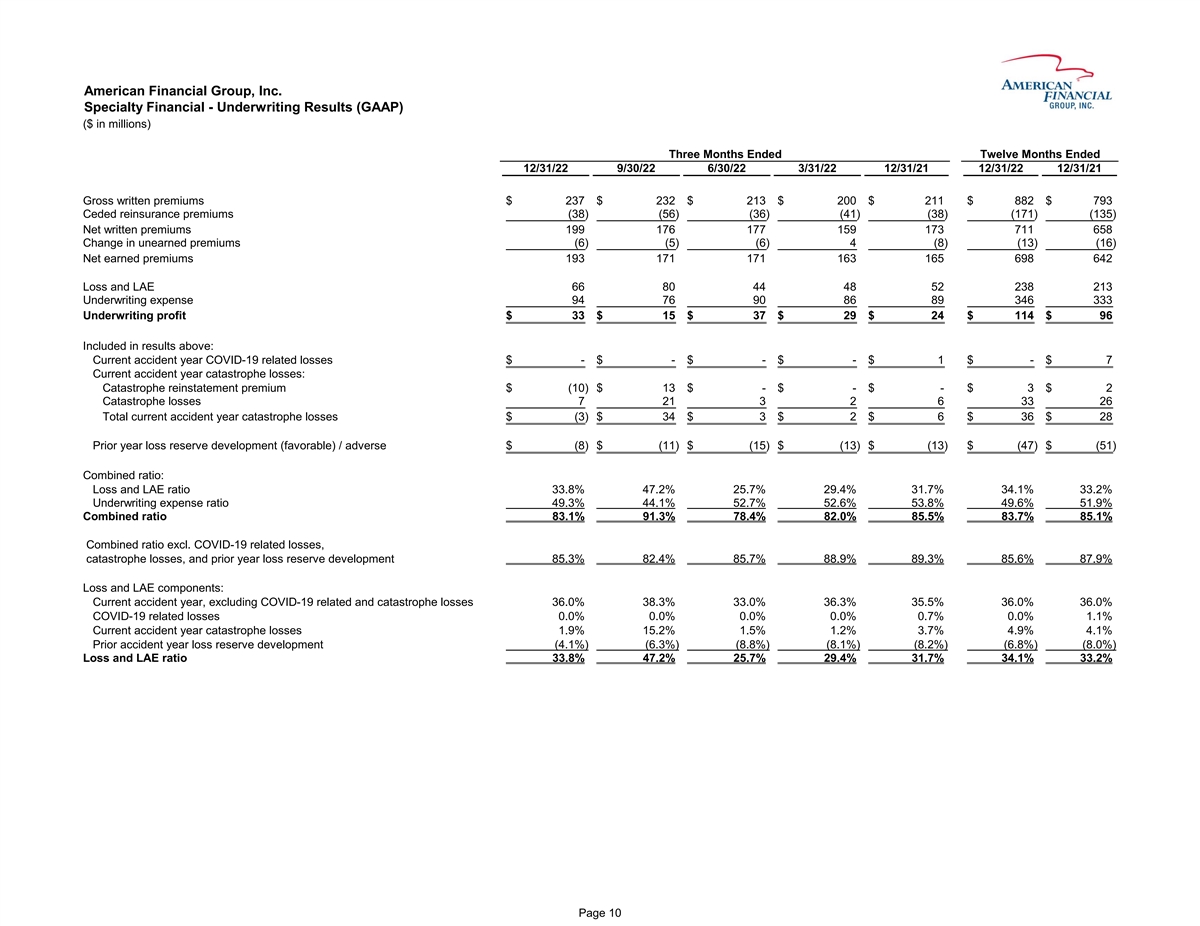
アメリカの金融グループは現在12/31/22 9/30/22 6/30/22 3/31/22 12/31/22 12/31/22 12/31/22 12/31/21毛保料$237$232$213$200$211$882$793(38)(56)(36)(41)(38) (171)(135)正味保険料変動未稼ぎ保険料(6)(5)(6)4(8)(13)(16)純利益193 171 163 165 698 642損失およびLAE 66 80 44 48 52 238 213引受費用94 76 90 86 89 346 333引受利益$33$15$37$29$24$114$96以上の結果は、本不慮の年の新冠肺炎関連損失$-$1$-$7今年度意外災害損失:巨大災害復旧保険料$(10)$13$− $−−$-$3$2巨大被害7 21 3 2 6 33 26現在の事故年の巨大災害損失総額$(3)$34$3$2$6$36$28前年損失準備金発展(有利)/不利$(8)$(11)$(15)$(13)$(47)$(51)総合 比率:損失と資産負債比率33.8%47.2%25.7%29.4%31.7%34.2%保険費用比率49.3%44.1%52.7%52.6%53.8%49.6%51.9%合併比率83.1%91.3%78.4%82.0%85.5%83.7%85.1%新冠肺炎関連損失、巨大災害損失、前年損失準備金発展85.3%82.4%85.7%88.9%89.3%85.6%87.9%損失及びLAE成分:現在の事故年、新冠肺炎関連損失と巨災損失を含まない36.0%38.3%33.0%36.3%35.5%36.0%36.0% 新冠肺炎関連損失0.0%0.0%0.7%0.1%1.1%現在の事故年巨大災害損失1.9%15.2%1.5%1.2%3.7%4.9%4.1%前事故年損失準備金発展(4.1%)(63.3%)(8.8%)(8.1%)(8.2%)(6.8%)損失とLAE比率 33.8%47.2%25.7%29.4%31.7%34.1%33.2%10ページ
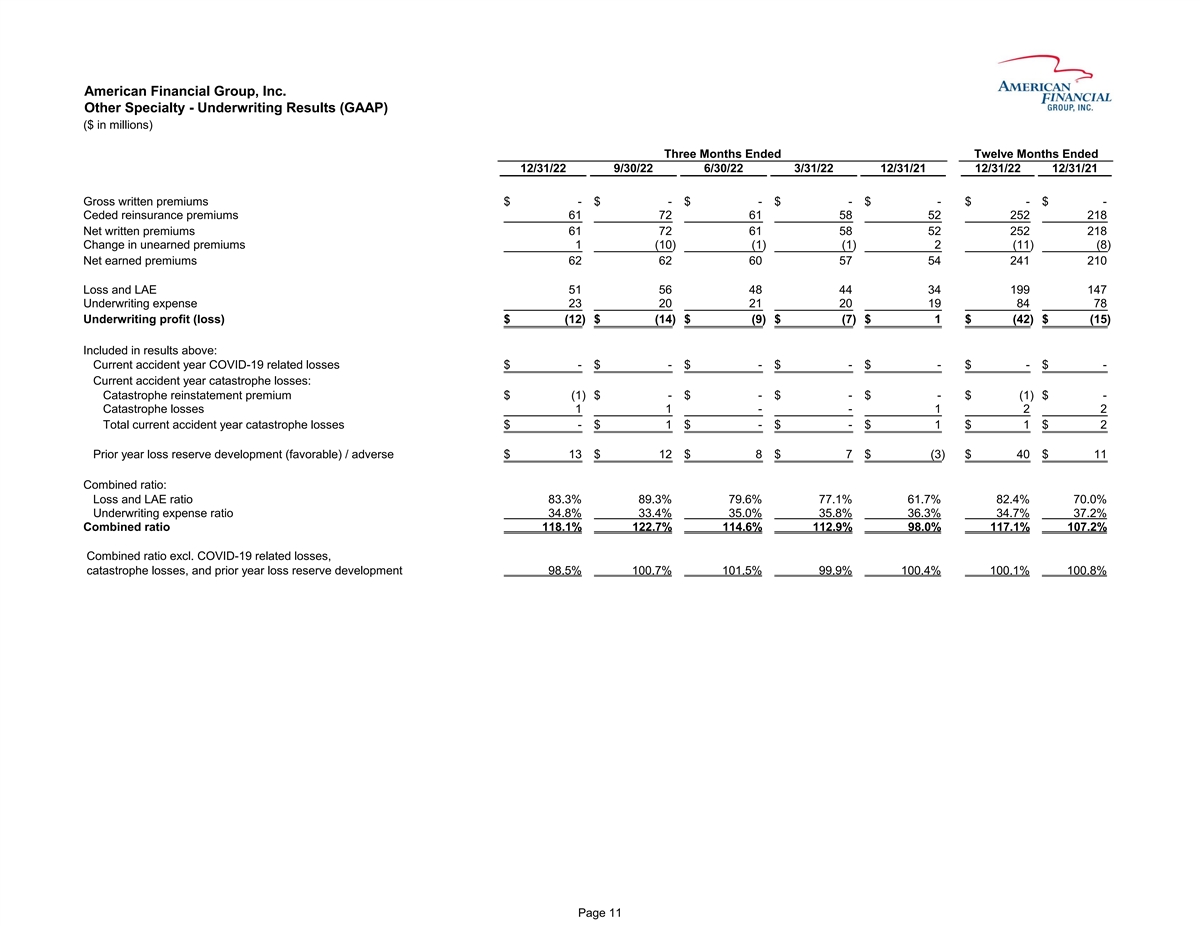
アメリカの金融グループは現在12/31/22 9/30/22 6/30/22 3/31/22 12/31/21 12/31/22 12/31/21毛保険料$-$-再保険料61 72 61 58 52 252 218正味保険料61 72 61 58 52 252 218稼いでいない保険料変動1(10)(1)(1)2(11)(8)純利益62 62 60 57 54 241 210損失およびLAE 51 56 48 44 44 199 147保険費用23 20 21 20 19 84 78引受利益(損失)$(12)$(14)$(9)$(7)$1$(42)$(15)以上の結果:現意外年新冠肺炎関連損失$−$−現在の不慮年巨大災害損失:巨大災害復旧保険料$(1)$−(1)$−巨大災害損失1−1−-現在の事故年の巨大災害損失総額$-$1$-$-$1$2前年損失準備金発展(有利)/不利$13$12$8$7$(3)$40$11合併比率:損失と資産負債比率83.3%89.3%79.6%77.1%61.7%82.4%70.0 保険費用比率34.8%33.4%35.8%36.3%34.7%37.2%合併比率118.1%122.7%114.6%112.9%98.0%117.1%107.2%合併比率を除く。新冠肺炎関連損失、巨大災害損失と前年損失準備金発展98.5% 100.7%101.5%99.9%100.4%100.1%100.8ページ11ページ
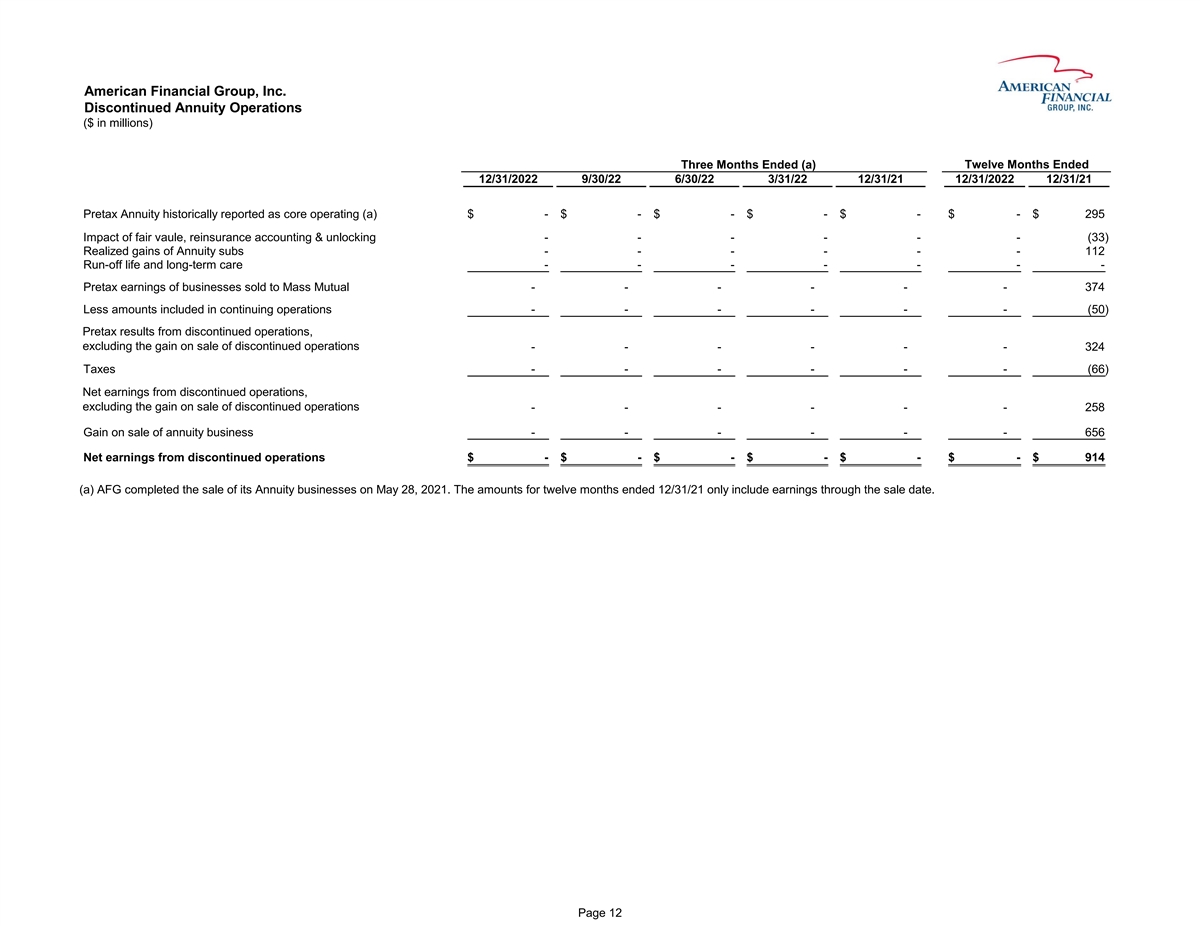
米国金融グループは年金業務(百万ドル単位)を終了して3ヶ月(A)まで12/31/2022 9/30/22 6/30/22 3/31/22 12/31/21 12/2022 12/31/21税引き前年金史上報告をコア運営としている(A)$−$295公平価値の影響。再保険会計とアンロック−(33)年金サブプロジェクトの実現収益--112個の流出寿命と長期介護--大衆互助事業に売却された税前収益−(50)非持続事業の税前収益。非連続業務を含まない販売収益である324税−(66)不連続業務の純収益,非連続業務を売却する収益 −−258の年金業務売却益である656不連続業務の純収益$−$−(A)AFGは2021年5月28日に年金業務の売却を完了した。21年12月31日までの12カ月分の金額は、販売日までの収益のみを含む。12ページ目
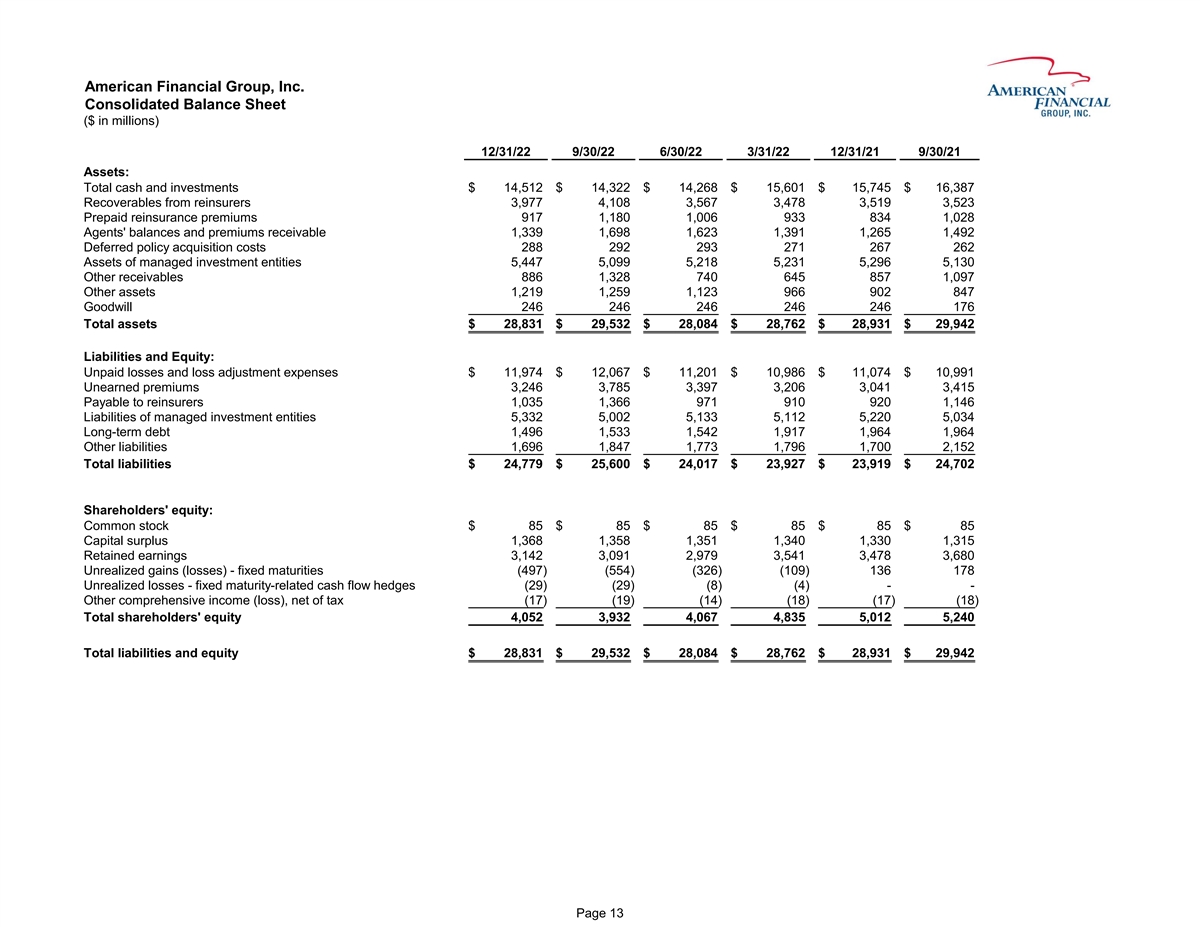
American Financial Group, Inc. Consolidated Balance Sheet ($ in millions) 12/31/22 9/30/22 6/30/22 3/31/22 12/31/21 9/30/21 Assets: Total cash and investments $ 14,512 $ 14,322 $ 14,268 $ 15,601 $ 15,745 $ 16,387 Recoverables from reinsurers 3,977 4,108 3,567 3,478 3,519 3,523 Prepaid reinsurance premiums 917 1,180 1,006 933 834 1,028 Agents' balances and premiums receivable 1,339 1,698 1,623 1,391 1,265 1,492 Deferred policy acquisition costs 288 292 293 271 267 262 Assets of managed investment entities 5,447 5,099 5,218 5,231 5,296 5,130 Other receivables 886 1,328 740 645 857 1,097 Other assets 1,219 1,259 1,123 966 902 847 Goodwill 246 246 246 246 246 176 Total assets $ 28,831 $ 29,532 $ 28,084 $ 28,762 $ 28,931 $ 29,942 Liabilities and Equity: Unpaid losses and loss adjustment expenses $ 11,974 $ 12,067 $ 11,201 $ 10,986 $ 11,074 $ 10,991 Unearned premiums 3,246 3,785 3,397 3,206 3,041 3,415 Payable to reinsurers 1,035 1,366 971 910 920 1,146 Liabilities of managed investment entities 5,332 5,002 5,133 5,112 5,220 5,034 Long-term debt 1,496 1,533 1,542 1,917 1,964 1,964 Other liabilities 1,696 1,847 1,773 1,796 1,700 2,152 Total liabilities $ 24,779 $ 25,600 $ 24,017 $ 23,927 $ 23,919 $ 24,702 Shareholders' equity: Common stock $ 85 $ 85 $ 85 $ 85 $ 85 $ 85 Capital surplus 1,368 1,358 1,351 1,340 1,330 1,315 Retained earnings 3,142 3,091 2,979 3,541 3,478 3,680 Unrealized gains (losses) - fixed maturities (497) (554) (326) (109) 136 178 Unrealized losses - fixed maturity-related cash flow hedges (29) (29) (8) (4) - - Other comprehensive income (loss), net of tax (17) (19) (14) (18) (17) (18) Total shareholders' equity 4,052 3,932 4,067 4,835 5,012 5,240 Total liabilities and equity $ 28,831 $ 29,532 $ 28,084 $ 28,762 $ 28,931 $ 29,942 Page 13
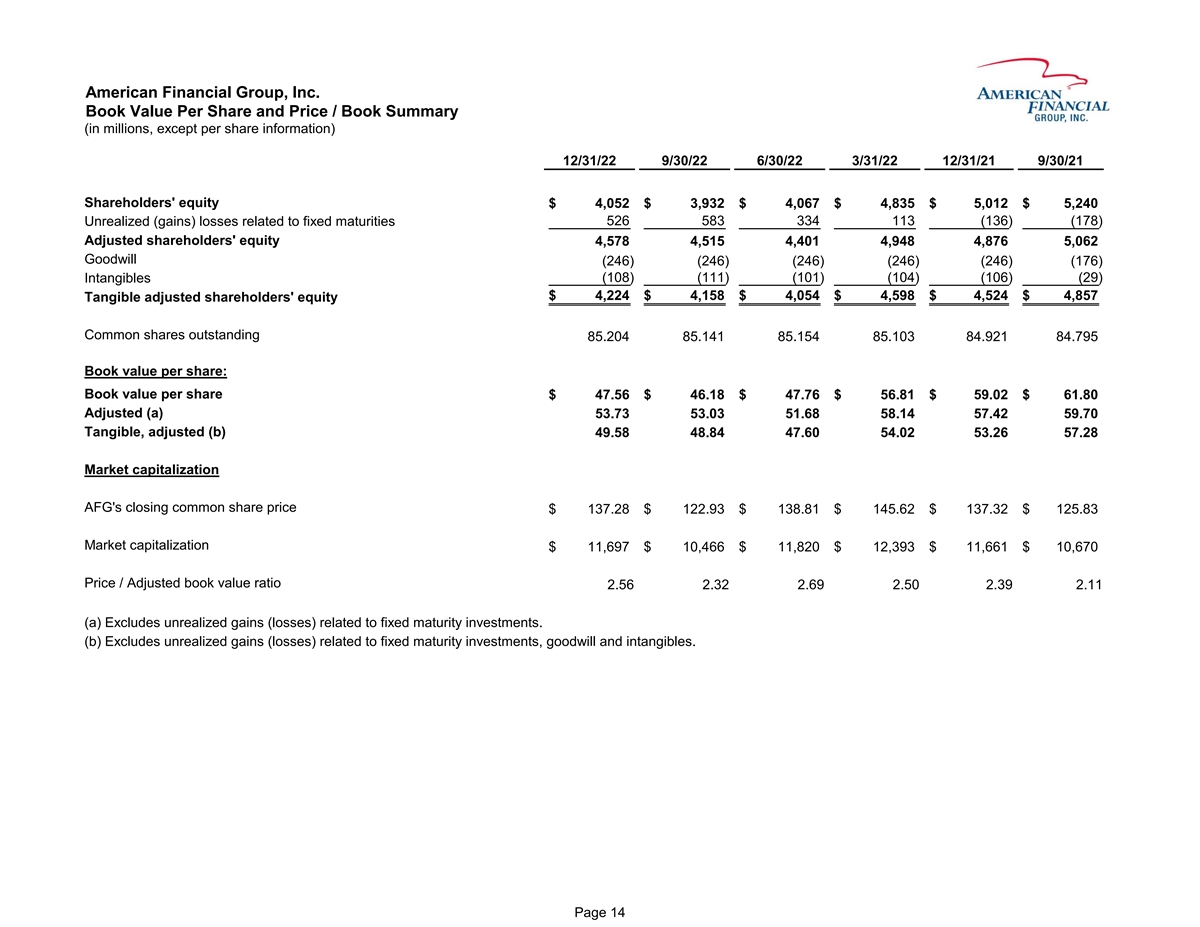
米国金融グループ、Inc.1株当たりの帳簿価値と1株当たりの帳簿価格/帳簿価格要約(単位:百万、1株当たり情報を除く)12/31/22 9/30/22 6/30/22 3/31/22 12/31/21 9/30/21株主資本$4,052$3,932$4,067$4,835$5,012$5,240 526 583 334 113(136)(178)固定 満期日に関する未達成(収益)損失4,578 4,515 4,401 4,948 4,876 5,062営業権(246)(2 46)(2 46)(246)(176)(1)(11)無形資産$4,224$4,158$4,054$4,598$4,524$4,857有形調整後の普通株式流通株85.204 85.141 85.154 85.103 84.921 84.795 1株当たりの帳簿価値:1株当たり帳簿価値$47.56$46.18$47.76$56.81$59.02$61.80調整後(A)53.73 53.03 51.68 58.14 57.42 59.70調整後の (B)49.58 48.84 47.60 54.02 53.26 57.28 AFGの終値普通株価格$137.28$122.93$138.81$145.62$137.32$125.83時価$11,697$10,466$11,820$12,393$11,661$10,670価格/調整後帳簿価値比率 比率2.56 2.32 2.69 2.50 2.39 2.11(A)は固定期限投資に関する未実現収益(損失)は含まれていない。(B)固定期限投資、営業権、および無形資産に関連する未実現収益(損失)は含まれていない。14ページ目
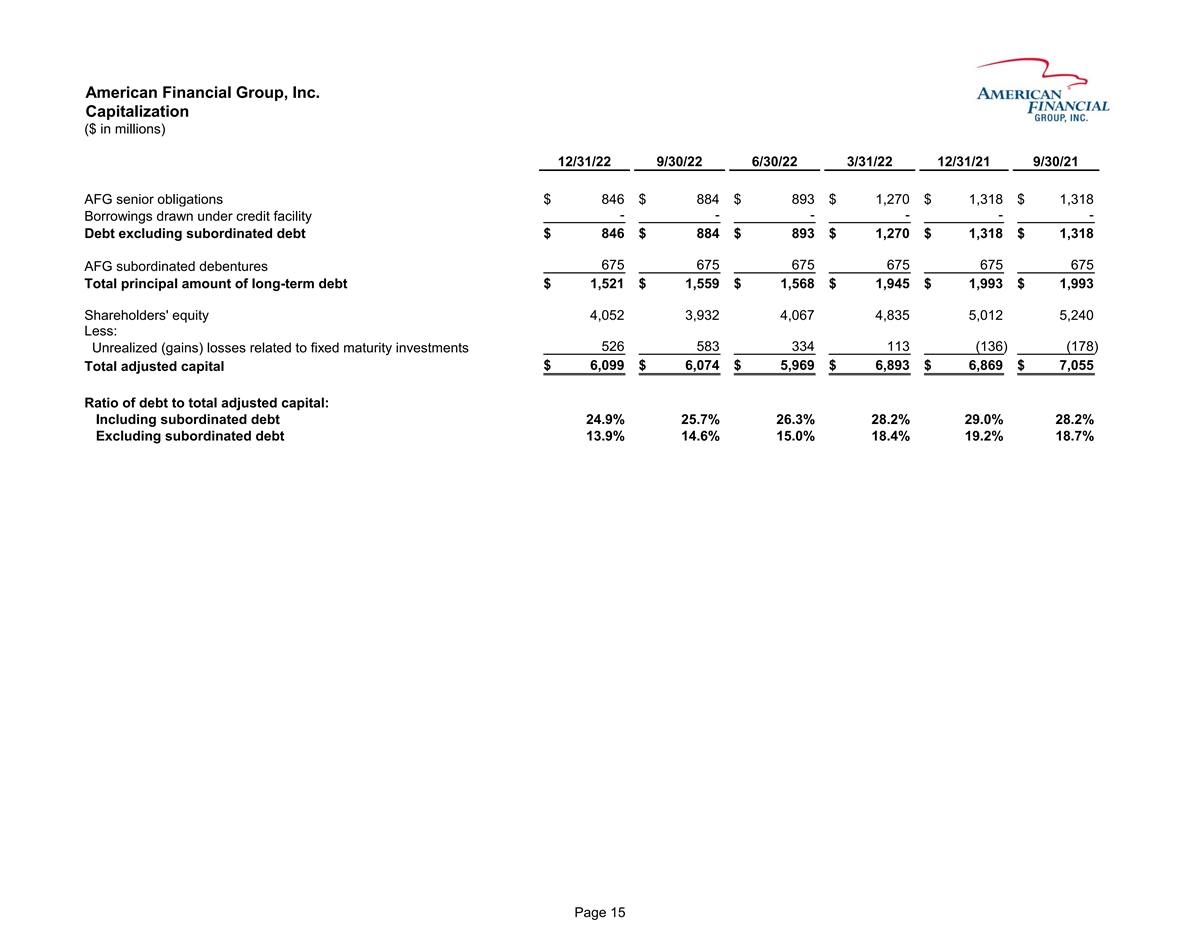
アメリカの金融グループは会社資本(百万ドル単位)12/31/22 9/30/22 6/30/22 3/31/22 12/31/21 9/30/21 AFG優先債務$846$884$893$1,270$1,318$1,318$1,270$1,270$1,318$1,318$1,318 675 675 AFG二次債券長期債務元金総額$1,521$1,559$1,568$1,945$1,993$1,993$1,993$4,052 3,932 4,0674,835 5,012 5,240:526 583 334 113(136)(178)固定期限投資に関する未実現(収益)損失$6,099$6,074$5,969$6,893$6,869$7,055債務の調整資本総額を含む比率:二次債務24.9%25.7%26.3%28.2%29.0%28.2%二次債務13.9%14.6% 15.0%18.4%19.2%18.7%15ページ
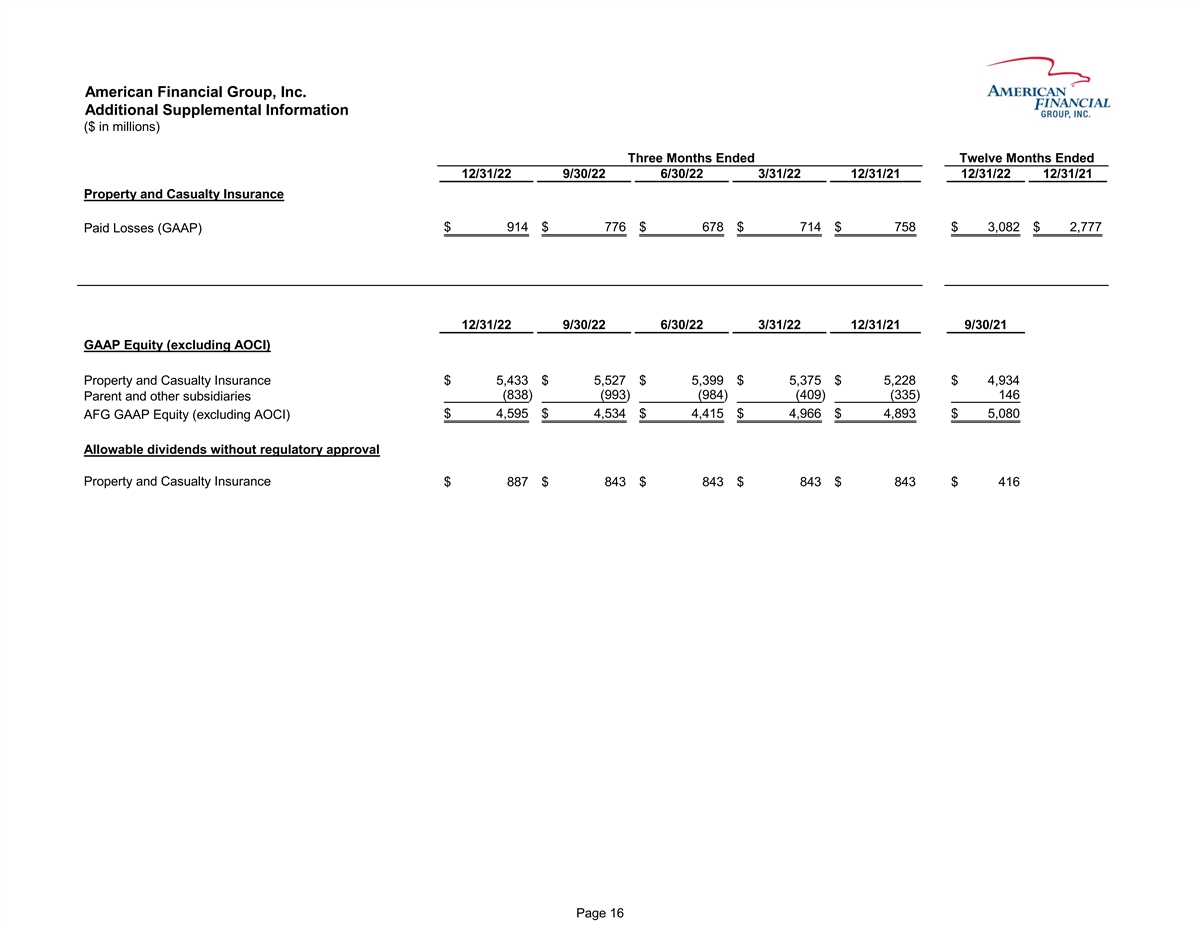
アメリカの金融グループは現在12/31/22 6/30/22 3/31/22 12/31/21 12/31/22 12/31/21財産および意外保険$914$776$678$714$758$3,082$2,777支払い損失(GAAP)12/31/22 9/30/22 6/30/22 3/31/22 12/31/21財産および意外保険$5,433$5,527$5,399$5,375$5,228$4,934(838)(993)(984)(409)(335)146親会社および他の子会社$4,595$4,534$4,415$4,966$4,893$5,080 AFG GAAP 規制部門の承認されていない持分(AOCIを除く)によって許可された配当財産および傷害保険$887$843$843$843$416ページ16ページ
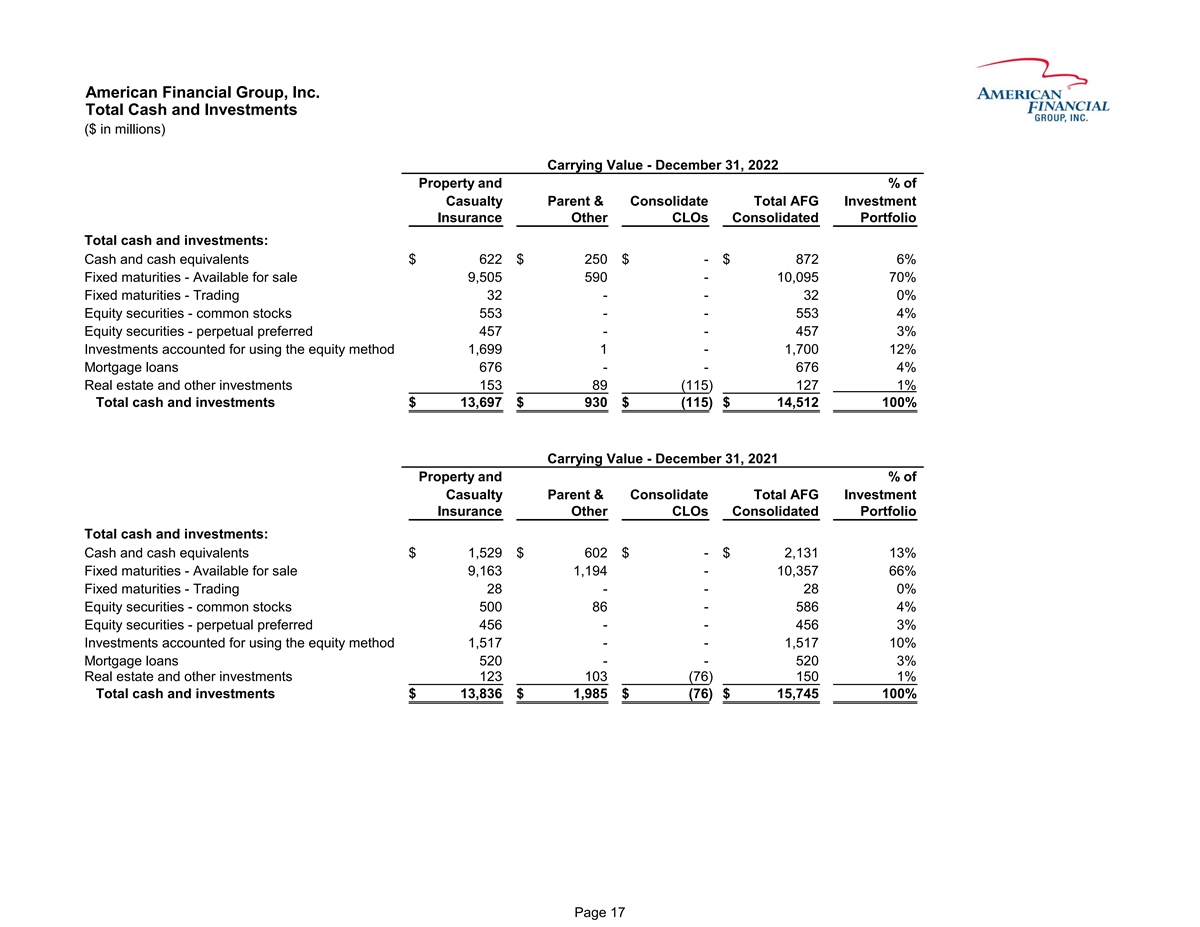
米金融グループの総現金と投資($in 百万)の帳簿価値-12月31日、2022財産および傷害親会社および合併総額AFG投資保険その他CLO連結ポートフォリオ現金および投資総額:現金と現金等価物$622$250$-$8726%固定 満期日-売却可能9,505 590-10,095 70%固定満期日--取引32-32 0%権益証券-普通株553-5534%権益証券-永久優先株457--4573%権益法を用いて計算された投資 1,699 1-1,700 12%担保融資676-676%不動産およびその他投資153(115現金と投資総額$13,697$930$(115)$14,512 100%帳簿価値-12月31日2021財産と傷害親会社と合併AFG投資保険その他CLO総合ポートフォリオ現金および投資総額:現金と現金等価物$1,529$602$-$2,131 13%固定満期日-売却可能9,163 1,194-10,357 66%固定満期日-取引28-28 0%権益証券-普通株500 86-586%権益証券-永久優先株456-4563%権益法を用いて計算された投資1,517-1,517 10%担保融資520-520 3%不動産およびその他投資123103(76)150%現金および投資総額$13,836$1,985$(76)$15,745 100%17ページ
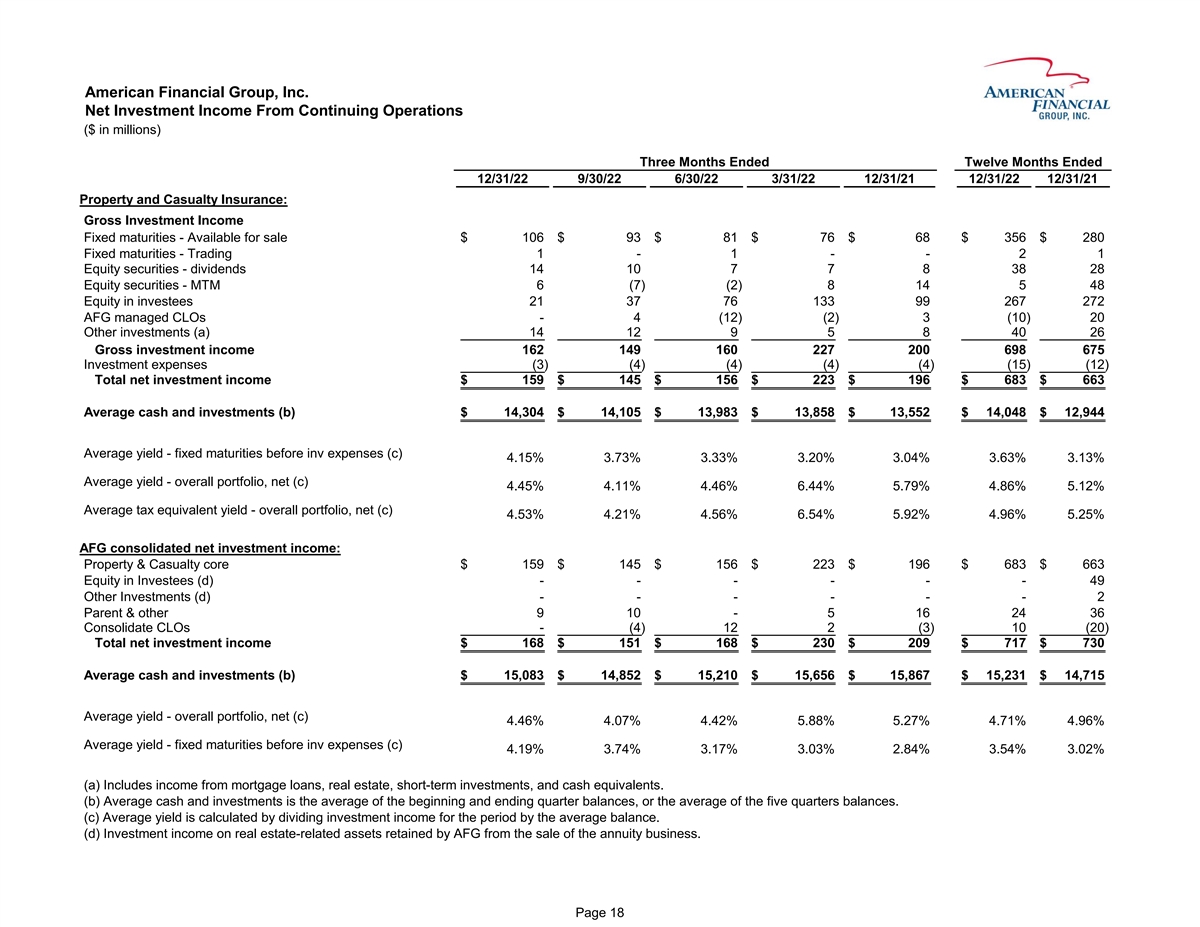
アメリカの金融グループは会社が継続的に経営している純投資収入(百万ドル単位)現在12/31/22 9/30/22 6/30/22 3/31/22 12/31/22 12/31/21財産および意外保険会社:総投資収益固定期限-販売可能$106$93$81$76$68$ 356$280固定期限-取引1-1-2 1持分証券-配当14 10 7 7 8 38 28持分証券-MTM 6(7)(2)8 14 5 48被投資者株式21 37 76 133 99 267 272 AFG管理のCLO-4(12)(2)3(10)20その他の投資(A) 14 12 9 5 8 40 26総投資収益162 149 160 227 200 698 675投資支出(3)(4)(4)(4)(4)(15)(12)総投資収益$159$145$156$223$196$683$663平均現金と投資(B)$14304ドル14,105ドル13,983ドル13,858ドル13,552ドル14,048ドル12,944平均収益率-在庫費用を差し引く前の固定満期日(C)4.15%3.73%3.33%3.20%3.04%3.63%3.13%平均収益率-全体ポートフォリオ,純額(C)4.45%4.11%4.46%6.44%5.79%4.86%5.12%平均税額同値収益率 -全体ポートフォリオ,純額(C)4.53%4.21%4.56%6.54%5.92%4.96%5.25%AFG総合純投資収益:財産と傷害コア$159$145$156$223$196$683$663被投資者持分(D)−−49その他投資(D)− −−2親会社と他の9 10−5 16 24 36合併CLO−(4)12 2(3)10(20)総投資純収益$168$151$168$230$209$717$730平均現金および投資(B)$15,083$14,852$15,210$15,656$15,867$15,231$14,715平均収益率-全体ポートフォリオ、純額(C)4.46%4.07%4.42%5.88%5.27%4.71%4.96%投資費用を差し引く前の固定収益率(C)4.19%3.74%3.17%3.03%2.84%3.54%3.02%(A)担保融資、不動産、短期投資を含む収入, 現金等価物です(B)平均現金および投資とは、四半期期初めおよび期末残高の平均値、または5四半期残高の平均値である。(C)平均収益率の算出方法は、その期間の投資収益を平均残高で割る。(D)AFGが売却年金業務から保留している不動産関連資産の投資収入。18ページ目
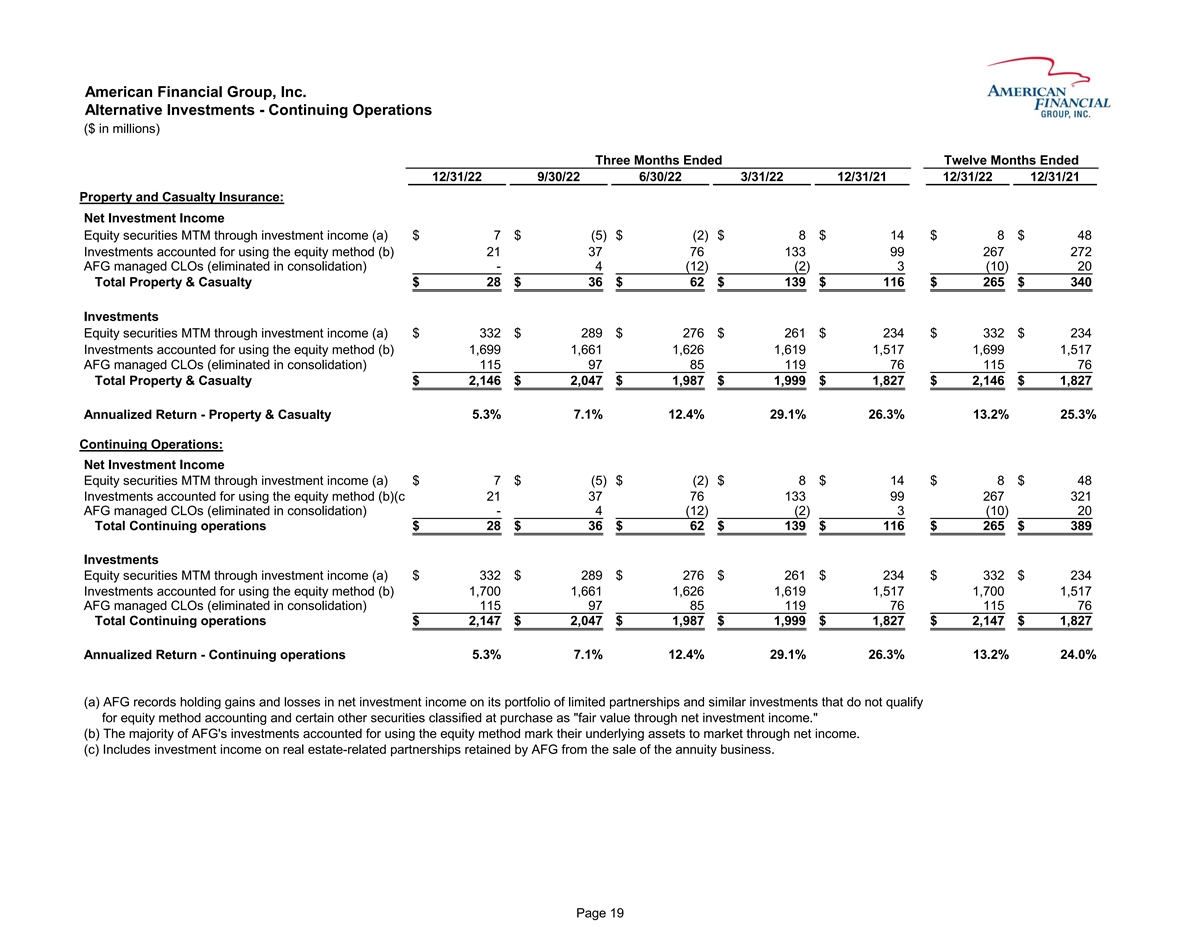
アメリカの金融グループは別の投資-持続的経営(百万ドル単位)現在12/31/22 9/30/22 6/30/22 3/31/22 12/31/22 12/31/21財産と意外保険会社:純投資収益(A)$7$(5)$(2) $8$14$8$48投資権益法(B)21 37 76 133 99 267 272 AFG管理のCLO(合併で除外)-4(12)(2)3(10)20財産および傷害保険総額$28$36$62$139$116$265$340投資 投資収益から計算した株式証券MTM(A)$332$289$276$261$234$332$234投資権益計算(B)1,699 1,661 1,626 1,6191,5171,699 1,517 AFGが管理するCLO(合併で淘汰された)115 97 85 119 76 115 76合計財産および傷害2,146$2,047$1,987$1,999$1,827$2,146$1827 5.3%7.1%12.4%29.1%26.3%13.2%25.3%年化リターン-財産と傷害持続経営:純投資収益権益証券 投資収益によるMTM(A)$7$(5)$(2)$8$14$8$48投資使用権益法計算(B)(C)21 37 37 76 99 267 321 AFG管理のCLO(合併中廃止)-4(12)(2)3(10)20持続経営総額${br28$36$62$139$116$265$389投資収益によって計算された株式証券MTM(A)$332$289$276$261$234$332$234投資権益法(B)1を採用し、700 1,6611,626 1,6191,517 1,700 1,517 AFG 管理のCLO(合併中廃止)115 97 85 119 76 115 76継続運用合計$2,147$2,047$1,987$1,999$1,827$2,147$1, 827年化リターン-持続運営5.3%7.1%12.4%29.1%26.3%13.2%24.0%(A)AFGは、その有限組合企業と類似ポートフォリオ(権益法会計資格に適合しない)といくつかの他の証券が購入時に純投資収入によって公正な価値に計上した純投資収益と損失を記録した。(B)AFGの大部分の投資は権益法を採用し,その対象資産は純収入により市価で計算される。(C)年金事業の売却からAFGが保持している不動産関連組合企業の投資収入を含む。19ページ
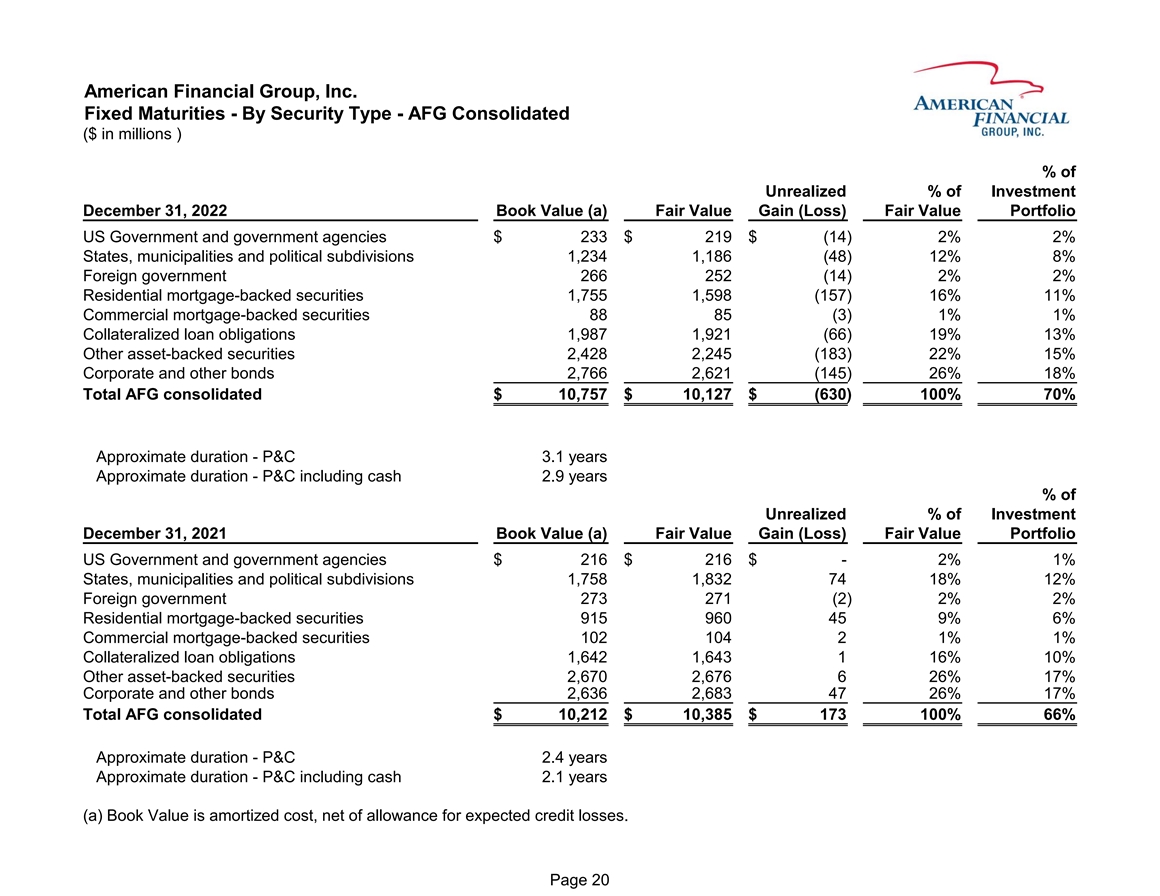
米国金融グループ会社の固定満期日-証券タイプ別-AFG合併(百万ドル単位)%投資を実現していない%2022年12月31日の帳簿価値(A)公正価値収益(損失)公正価値ポートフォリオ米政府と政府機関$233$219$(14)2%各州市政·政治区分1,234 1,186(48)12%8%外国政府266 252(14)2%2%2%住宅担保融資支援証券1,755 1,598(157)16%11%商業担保融資支援証券88 85(3)1%1%担保融資債券1,987 1,921(66)19% 13%その他資産支援証券2,428 2,245(183)22%15%社債と他の2,766 2,621(145)26%18%総AFG合併$10,757$10,127$(630)100%約70%期限-P&C 3.1年間の約持続時間-P&C 現金2.9%未実現投資の割合12月31日を含む2021年帳簿価値(A)公正価値収益(損失)公正価値ポートフォリオ米国政府と政府機関$216$216$-2%各州都市·行政区1,758 1,832 74 18%12%外国政府273 271(2)2%2%住宅担保融資支援証券915 960 45 9%6%商業担保融資支援証券102 104 21%1%10%その他資産支援証券 2,670 2,676 6 26%17%社債と他の債券2,636 2,683 47 26%17%AFG合併総額$10,212$10,385$173 100%66%約期限-P&C約2.4年期間-P&C現金2.1年(A)帳簿価値 予想信用損失準備後の純額を差し引く。20ページ目
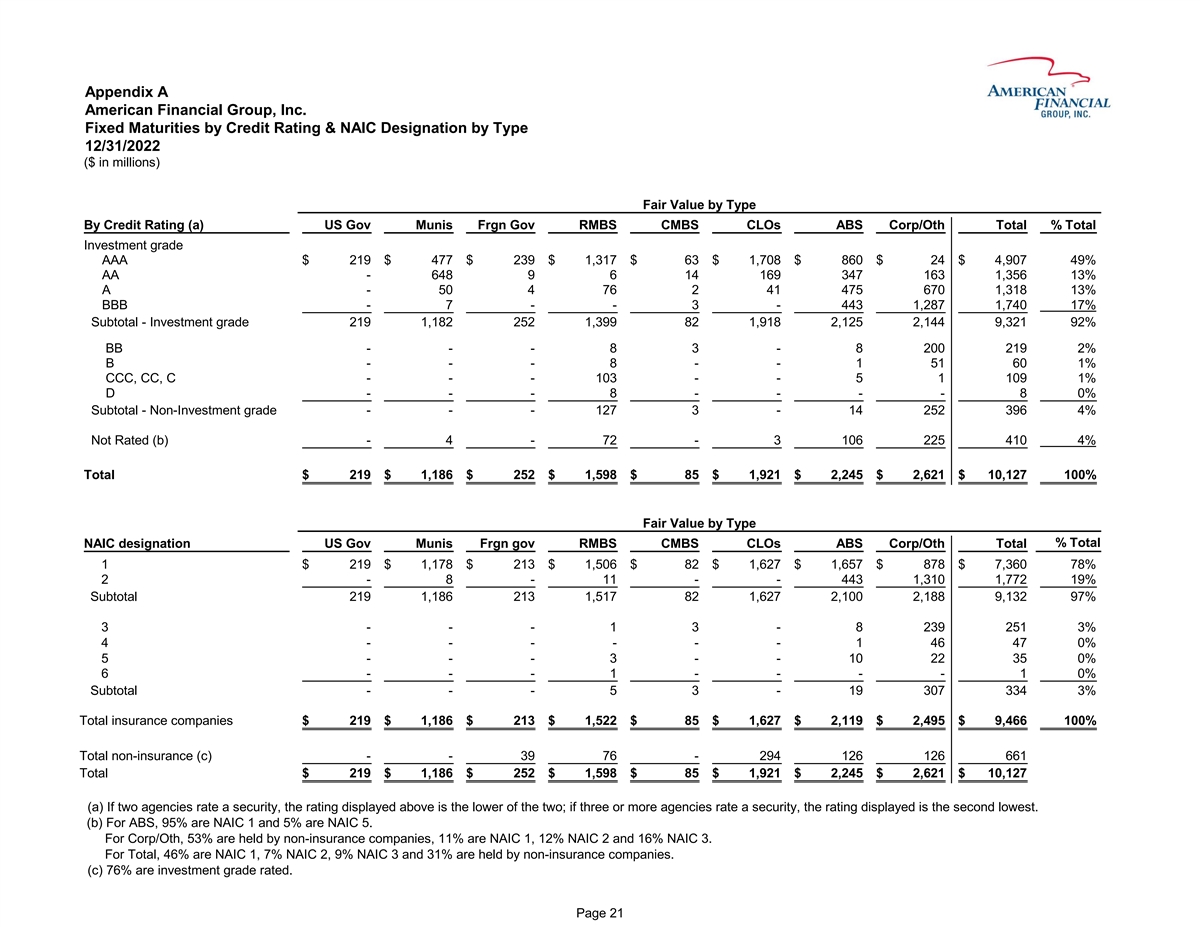
Appendix A American Financial Group, Inc. Fixed Maturities by Credit Rating & NAIC Designation by Type 12/31/2022 ($ in millions) Fair Value by Type By Credit Rating (a) US Gov Munis Frgn Gov RMBS CMBS CLOs ABS Corp/Oth Total % Total Investment grade AAA $ 219 $ 477 $ 239 $ 1,317 $ 63 $ 1,708 $ 860 $ 24 $ 4,907 49% AA - 648 9 6 14 169 347 163 1,356 13% A - 50 4 76 2 41 475 670 1,318 13% BBB - 7 - - 3 - 443 1,287 1,740 17% Subtotal - Investment grade 219 1,182 252 1,399 82 1,918 2,125 2,144 9,321 92% BB - - - 8 3 - 8 200 219 2% B - - - 8 - - 1 51 60 1% CCC, CC, C - - - 103 - - 5 1 109 1% D - - - 8 - - - - 8 0% Subtotal - Non-Investment grade - - - 127 3 - 14 252 396 4% Not Rated (b) - 4 - 72 - 3 106 225 410 4% Total $ 219 $ 1,186 $ 252 $ 1,598 $ 85 $ 1,921 $ 2,245 $ 2,621 $ 10,127 100% Fair Value by Type % Total NAIC designation US Gov Munis Frgn gov RMBS CMBS CLOs ABS Corp/Oth Total 1 $ 219 $ 1,178 $ 213 $ 1,506 $ 82 $ 1,627 $ 1,657 $ 878 $ 7,360 78% 2 - 8 - 11 - - 443 1,310 1,772 19% Subtotal 219 1,186 213 1,517 82 1,627 2,100 2,188 9,132 97% 3 - - - 1 3 - 8 239 251 3% 4 - - - - - - 1 46 47 0% 5 - - - 3 - - 10 22 35 0% 6 - - - 1 - - - - 1 0% Subtotal - - - 5 3 - 19 307 334 3% Total insurance companies $ 219 $ 1,186 $ 213 $ 1,522 $ 85 $ 1,627 $ 2,119 $ 2,495 $ 9,466 100% Total non-insurance (c) - - 39 76 - 294 126 126 661 Total $ 219 $ 1,186 $ 252 $ 1,598 $ 85 $ 1,921 $ 2,245 $ 2,621 $ 10,127 (a) If two agencies rate a security, the rating displayed above is the lower of the two; if three or more agencies rate a security, the rating displayed is the second lowest. (b) For ABS, 95% are NAIC 1 and 5% are NAIC 5. For Corp/Oth, 53% are held by non-insurance companies, 11% are NAIC 1, 12% NAIC 2 and 16% NAIC 3. For Total, 46% are NAIC 1, 7% NAIC 2, 9% NAIC 3 and 31% are held by non-insurance companies. (c) 76% are investment grade rated. Page 21
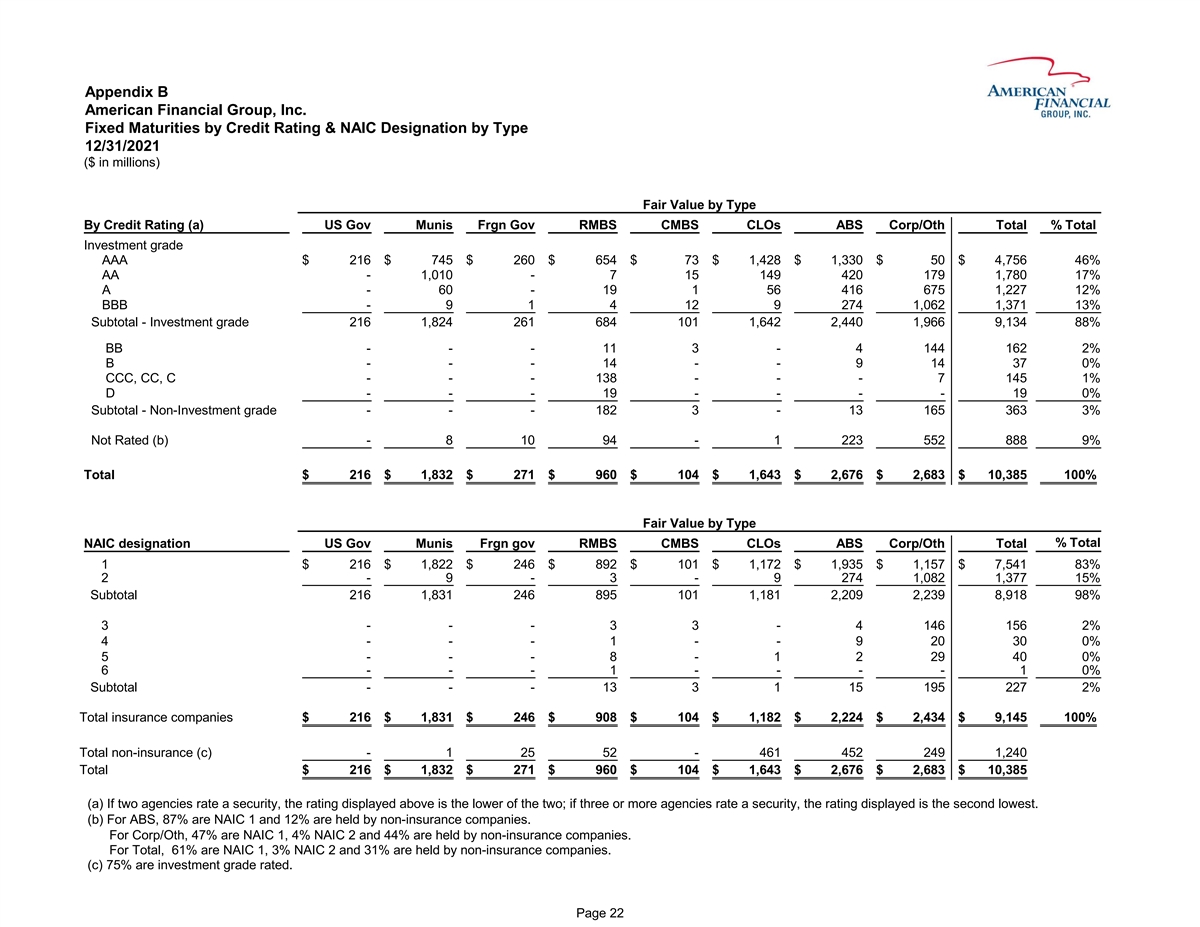
Appendix B American Financial Group, Inc. Fixed Maturities by Credit Rating & NAIC Designation by Type 12/31/2021 ($ in millions) Fair Value by Type By Credit Rating (a) US Gov Munis Frgn Gov RMBS CMBS CLOs ABS Corp/Oth Total % Total Investment grade AAA $ 216 $ 745 $ 260 $ 654 $ 73 $ 1,428 $ 1,330 $ 50 $ 4,756 46% AA - 1,010 - 7 15 149 420 179 1,780 17% A - 60 - 19 1 56 416 675 1,227 12% BBB - 9 1 4 12 9 274 1,062 1,371 13% Subtotal - Investment grade 216 1,824 261 684 101 1,642 2,440 1,966 9,134 88% BB - - - 11 3 - 4 144 162 2% B - - - 14 - - 9 14 37 0% CCC, CC, C - - - 138 - - - 7 145 1% D - - - 19 - - - - 19 0% Subtotal - Non-Investment grade - - - 182 3 - 13 165 363 3% Not Rated (b) - 8 10 94 - 1 223 552 888 9% Total $ 216 $ 1,832 $ 271 $ 960 $ 104 $ 1,643 $ 2,676 $ 2,683 $ 10,385 100% Fair Value by Type % Total NAIC designation US Gov Munis Frgn gov RMBS CMBS CLOs ABS Corp/Oth Total 1 $ 216 $ 1,822 $ 246 $ 892 $ 101 $ 1,172 $ 1,935 $ 1,157 $ 7,541 83% 2 - 9 - 3 - 9 274 1,082 1,377 15% Subtotal 216 1,831 246 895 101 1,181 2,209 2,239 8,918 98% 3 - - - 3 3 - 4 146 156 2% 4 - - - 1 - - 9 20 30 0% 5 - - - 8 - 1 2 29 40 0% 6 - - - 1 - - - - 1 0% Subtotal - - - 13 3 1 15 195 227 2% Total insurance companies $ 216 $ 1,831 $ 246 $ 908 $ 104 $ 1,182 $ 2,224 $ 2,434 $ 9,145 100% Total non-insurance (c) - 1 25 52 - 461 452 249 1,240 Total $ 216 $ 1,832 $ 271 $ 960 $ 104 $ 1,643 $ 2,676 $ 2,683 $ 10,385 (a) If two agencies rate a security, the rating displayed above is the lower of the two; if three or more agencies rate a security, the rating displayed is the second lowest. (b) For ABS, 87% are NAIC 1 and 12% are held by non-insurance companies. For Corp/Oth, 47% are NAIC 1, 4% NAIC 2 and 44% are held by non-insurance companies. For Total, 61% are NAIC 1, 3% NAIC 2 and 31% are held by non-insurance companies. (c) 75% are investment grade rated. Page 22
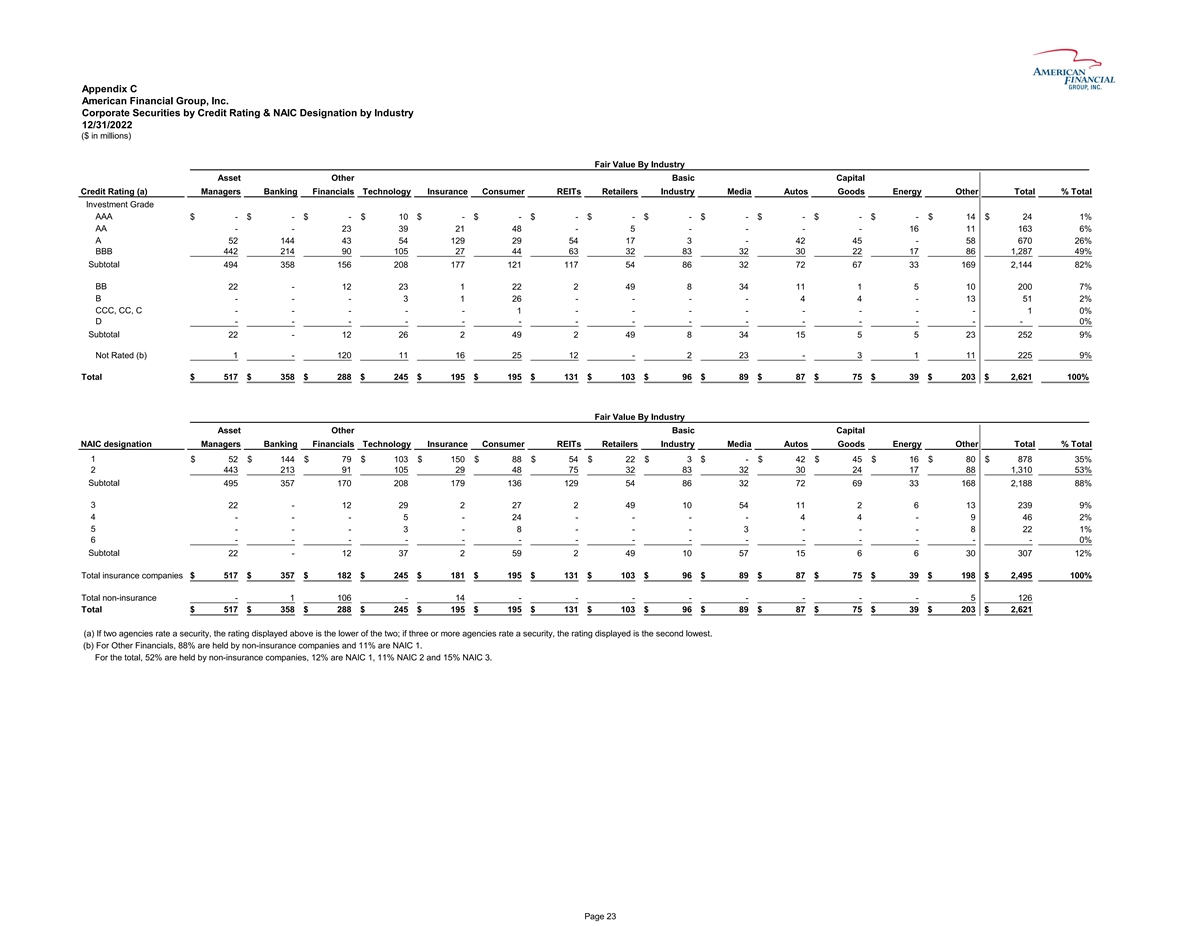
Appendix C American Financial Group, Inc. Corporate Securities by Credit Rating & NAIC Designation by Industry 12/31/2022 ($ in millions) Fair Value By Industry Asset Other Basic Capital Credit Rating (a) Managers Banking Financials Technology Insurance Consumer REITs Retailers Industry Media Autos Goods Energy Other Total % Total Investment Grade AAA $ - $ - $ - $ 10 $ - $ - $ - $ - $ - $ - $ - $ - $ - $ 14 $ 24 1% AA - - 23 39 21 48 - 5 - - - - 16 11 163 6% A 52 144 43 54 129 29 54 17 3 - 42 45 - 58 670 26% BBB 442 214 90 105 27 44 63 32 83 32 30 22 17 86 1,287 49% Subtotal 494 358 156 208 177 121 117 54 86 32 72 67 33 169 2,144 82% BB 22 - 12 23 1 22 2 49 8 34 11 1 5 10 200 7% B - - - 3 1 26 - - - - 4 4 - 13 51 2% CCC, CC, C - - - - - 1 - - - - - - - - 1 0% D - - - - - - - - - - - - - - - 0% Subtotal 22 - 12 26 2 49 2 49 8 34 15 5 5 23 252 9% Not Rated (b) 1 - 120 11 16 25 12 - 2 23 - 3 1 11 225 9% Total $ 517 $ 358 $ 288 $ 245 $ 195 $ 195 $ 131 $ 103 $ 96 $ 89 $ 87 $ 75 $ 39 $ 203 $ 2,621 100% Fair Value By Industry Asset Other Basic Capital NAIC designation Managers Banking Financials Technology Insurance Consumer REITs Retailers Industry Media Autos Goods Energy Other Total % Total 1 $ 52 $ 144 $ 79 $ 103 $ 150 $ 88 $ 54 $ 22 $ 3 $ - $ 42 $ 45 $ 16 $ 80 $ 878 35% 2 443 213 91 105 29 48 75 32 83 32 30 24 17 88 1, 310 53% Subtotal 495 357 170 208 179 136 129 54 86 32 72 69 33 168 2,188 88% 3 22 - 12 29 2 27 2 49 10 54 11 2 6 13 239 9% 4 - - - 5 - 24 - - - - 4 4 - 9 46 2% 5 - - - 3 - 8 - - - 3 - - - 8 22 1% 6 - - - - - - - - - - - - - - - 0% Subtotal 22 - 12 37 2 59 2 49 10 57 15 6 6 30 307 12% Total insurance companies $ 517 $ 357 $ 182 $ 245 $ 181 $ 195 $ 131 $ 103 $ 96 $ 89 $ 87 $ 75 $ 39 $ 198 $ 2,495 100% Total non-insurance - 1 106 - 14 - - - - - - - - 5 126 Total $ 517 $ 358 $ 288 $ 245 $ 195 $ 195 $ 131 $ 103 $ 96 $ 89 $ 87 $ 75 $ 39 $ 203 $ 2,621 (a) If two agencies rate a security, the rating displayed above is the lower of the two; if three or more agencies rate a security, the rating displayed is the second lowest. (b) For Other Financials, 88% are held by non-insurance companies and 11% are NAIC 1. For the total, 52% are held by non-insurance companies, 12% are NAIC 1, 11% NAIC 2 and 15% NAIC 3. Page 23
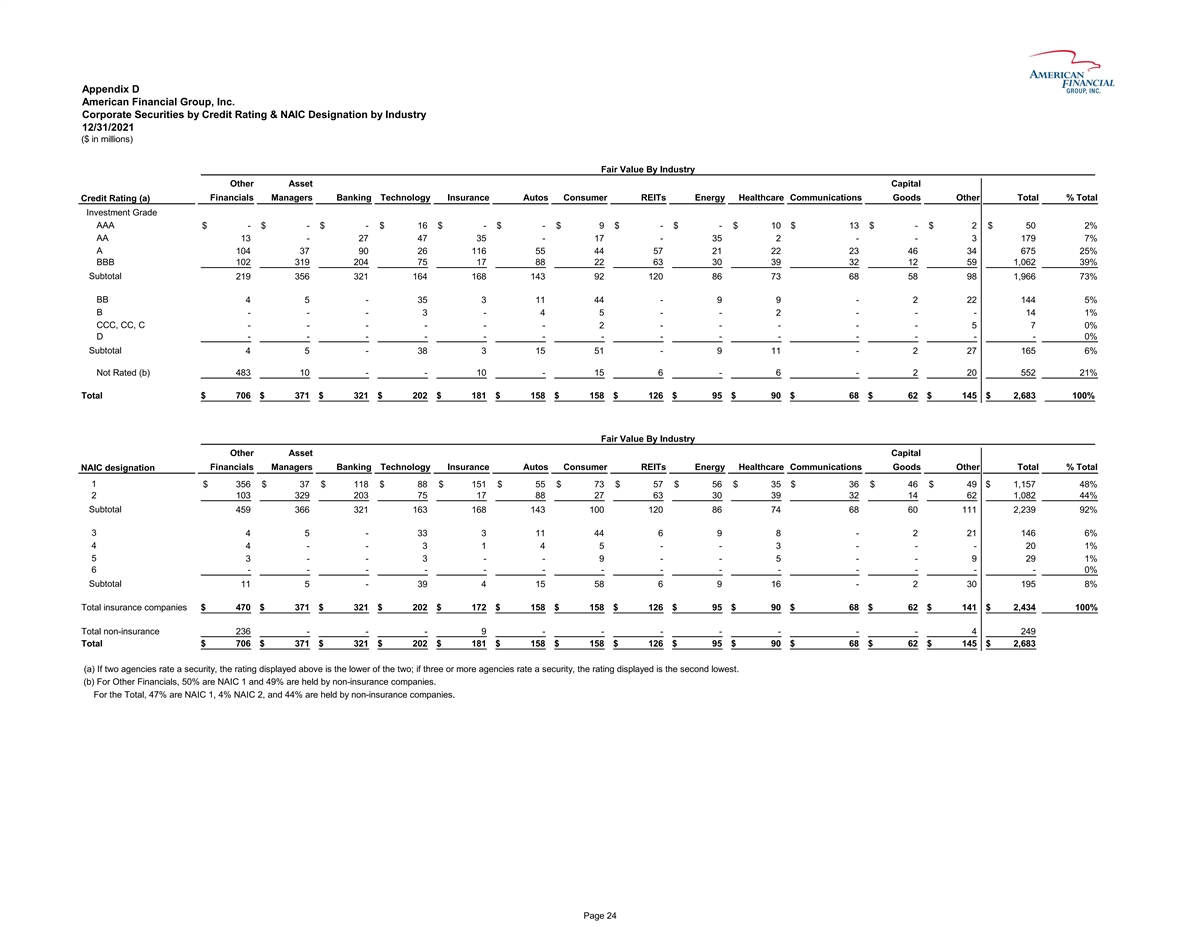
Appendix D American Financial Group, Inc. Corporate Securities by Credit Rating & NAIC Designation by Industry 12/31/2021 ($ in millions) Fair Value By Industry Other Asset Capital Financials Managers Banking Technology Insurance Autos Consumer REITs Energy Healthcare Communications Goods Other Total % Total Credit Rating (a) Investment Grade AAA $ - $ - $ - $ 16 $ - $ - $ 9 $ - $ - $ 10 $ 13 $ - $ 2 $ 50 2% AA 13 - 27 47 35 - 17 - 35 2 - - 3 179 7% A 104 37 90 26 116 55 44 57 21 22 23 46 34 675 25% BBB 102 319 204 75 17 88 22 63 30 39 32 12 59 1,062 39% Subtotal 219 356 321 164 168 143 92 120 86 73 68 58 98 1,966 73% BB 4 5 - 35 3 11 44 - 9 9 - 2 22 144 5% B - - - 3 - 4 5 - - 2 - - - 14 1% CCC, CC, C - - - - - - 2 - - - - - 5 7 0% D - - - - - - - - - - - - - - 0% Subtotal 4 5 - 38 3 15 51 - 9 11 - 2 27 165 6% Not Rated (b) 483 10 - - 10 - 15 6 - 6 - 2 20 552 21% Total $ 706 $ 371 $ 321 $ 202 $ 181 $ 158 $ 158 $ 126 $ 95 $ 90 $ 68 $ 62 $ 145 $ 2 ,683 100% Fair Value By Industry Other Asset Capital Financials Managers Banking Technology Insurance Autos Consumer REITs Energy Healthcare Communications Goods Other Total % Total NAIC designation 1 $ 356 $ 37 $ 118 $ 88 $ 151 $ 55 $ 73 $ 57 $ 56 $ 35 $ 36 $ 46 $ 49 $ 1,157 48% 2 103 329 203 75 17 88 27 63 30 39 32 14 62 1,082 44% Subtotal 459 366 321 163 168 143 100 120 86 74 68 60 111 2,239 92% 3 4 5 - 33 3 11 44 6 9 8 - 2 21 146 6% 4 4 - - 3 1 4 5 - - 3 - - - 20 1% 5 3 - - 3 - - 9 - - 5 - - 9 29 1% 6 - - - - - - - - - - - - - - 0% Subtotal 11 5 - 39 4 15 58 6 9 16 - 2 30 195 8% Total insurance companies $ 470 $ 371 $ 321 $ 202 $ 172 $ 158 $ 158 $ 126 $ 95 $ 90 $ 68 $ 62 $ 141 $ 2 ,434 100% Total non-insurance 236 - - - 9 - - - - - - - 4 249 Total $ 706 $ 371 $ 321 $ 202 $ 181 $ 158 $ 158 $ 126 $ 95 $ 90 $ 68 $ 62 $ 145 $ 2 ,683 (a) If two agencies rate a security, the rating displayed above is the lower of the two; if three or more agencies rate a security, the rating displayed is the second lowest. (b) For Other Financials, 50% are NAIC 1 and 49% are held by non-insurance companies. For the Total, 47% are NAIC 1, 4% NAIC 2, and 44% are held by non-insurance companies. Page 24
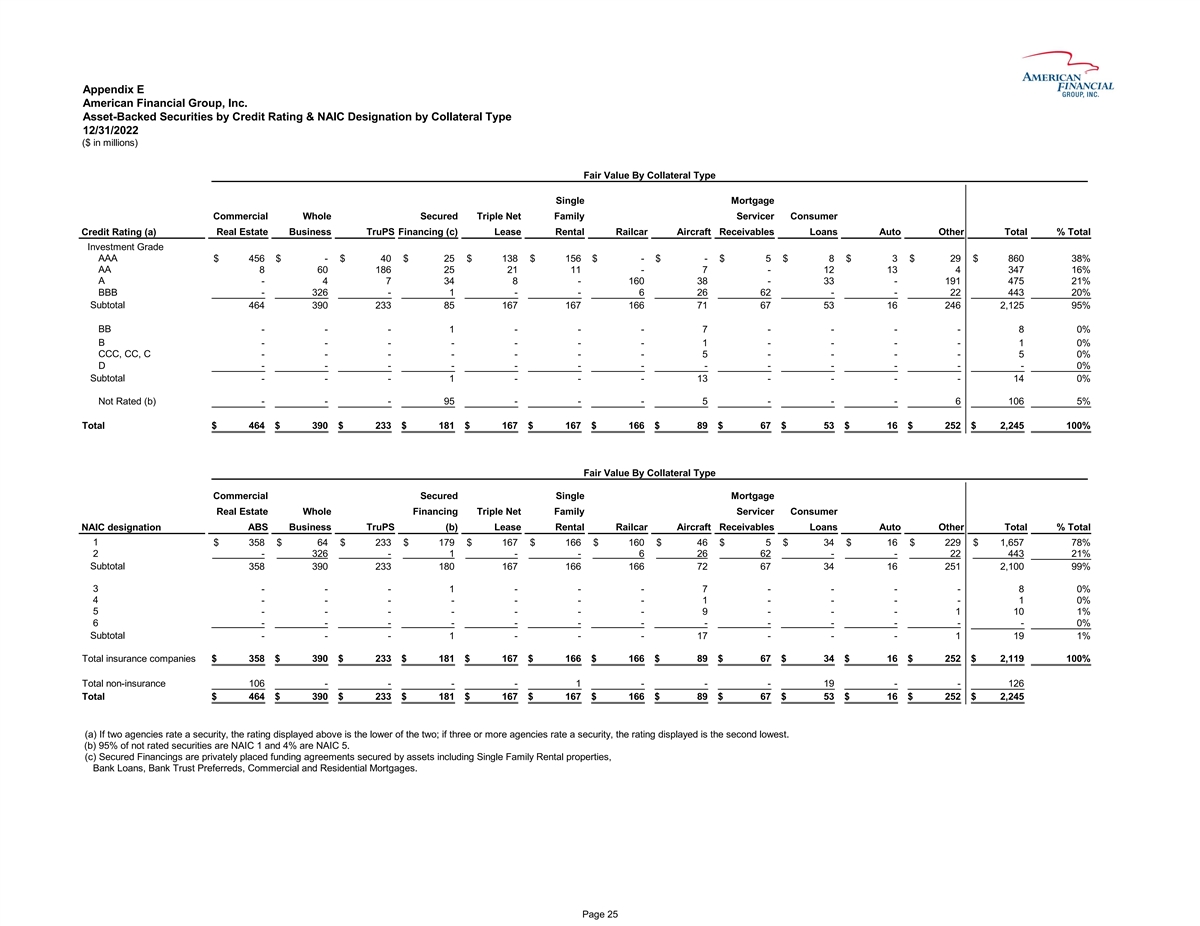
付録Eアメリカ金融グループは担保別資産支援証券12/31/2022(百万ドル単位)担保別公正価値担保タイプ単一担保商業全体保証三重純資産家庭サービス業者消費者不動産業務TruPS融資(C)リース航空機売掛金自動車その他総信用格付け(A)投資レベルAAA$456$-$40$25$138$156$-$-$5$3$29$860 38%AA 8 60 186 25 11-7-12 13 4 347 16%A-4 7 34 8-160 38-33-191 475 21%bbb-326-1-6 26 62-22 443 20%合計464 390 233 85 167 167 71 67 53 16 462125 95%BB--1--7--80%B--1--10%CCC、CC、C--5--50%D--140%未格付け(B)---95--5--6 106 5%合計$464$390$233$181$167$167$166元89元67元53元16元252元245 100%担保タイプ別公正価値商業保証単一住宅ローン不動産全体 融資三純ホームサービス消費者NAIC指定ABS商業信託(B)レンタル鉄道航空機売掛金自動車その他の総額合計1$358$64$233$179$167$166$160$46$5$34$16$229$1,657 78%2-326- 1-6 26 62-22 443 21%小計358 390 233 180 167 166 62 67 34 16 251 2100 99%3--1--8 0%4--1--1 10 1%6保険会社総数$358$390$233$181$167$166$166$89$67$34$16$252$2,119 100%非保険合計106--1--19--126合計$464$390$233$181$167$167$166$89$67$53$16$252$2,245(A)2つの格付け機関のような証券格付け, 上に示された格付けは、2つの格付けのうちの低い1つであり、3つ以上の機関が1つの証券を格付けする場合、表示される格付けは2番目に低い。(B)未格付け証券の95%がNAIC 1、4%がNAIC 5である。(C)担保付き融資は、独戸賃貸物件、銀行ローン、銀行信託優先株、商業および住宅ローンを含む資産担保である。25ページ目
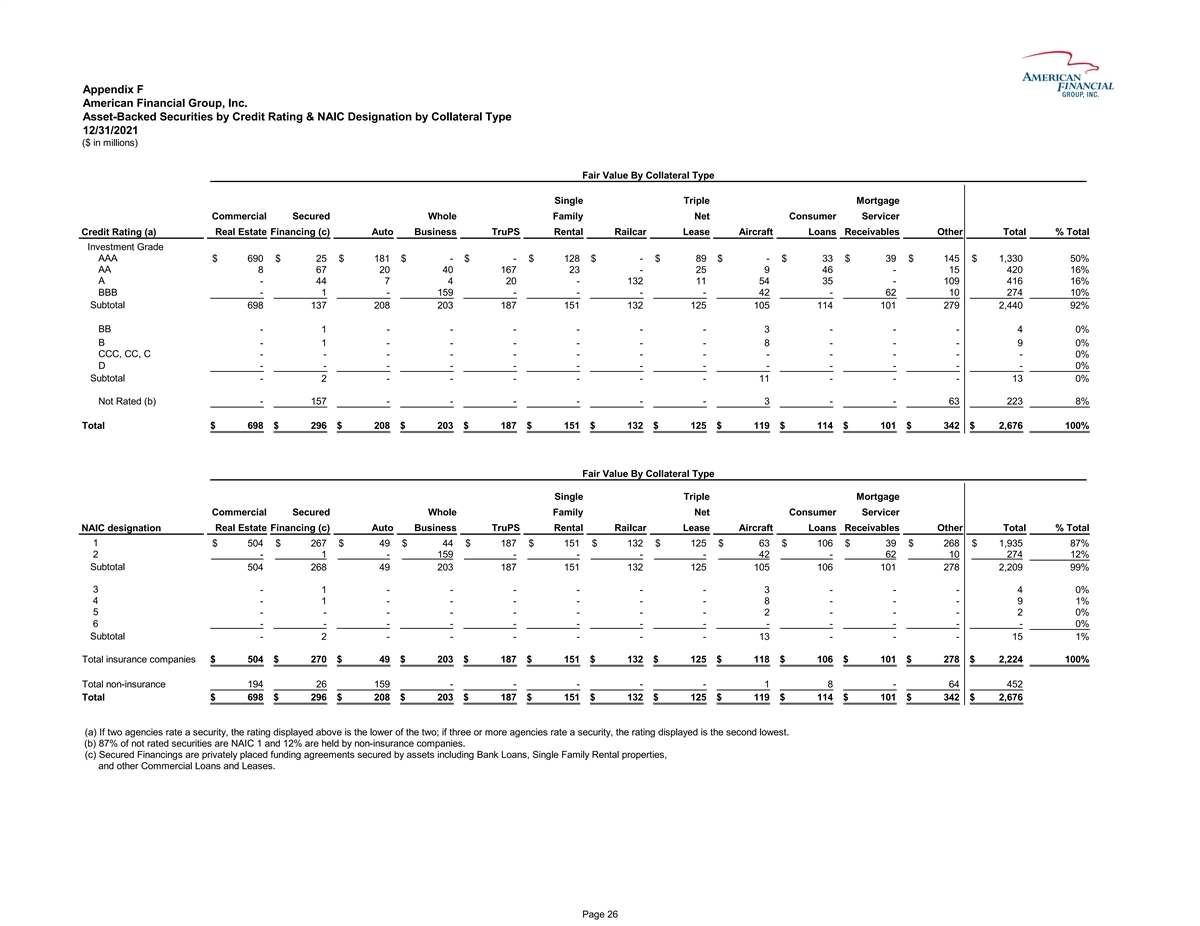
付録F米国金融グループ資産支援証券担保別信用格付けとNAIC指定タイプ12/31/2021(百万ドル単位)担保別公正価値担保タイプ単一三重担保商業担保ファミリーマート純消費者不動産融資(C)自動車事業TruPSリース 鉄道リース航空機ローン売掛金その他総信用格付け(A)投資レベルAAA$690$25$181$-$-$128$-$89$-33$33$145$1,330 50%AA 8 67 20 40 167 23-25 9 46-15 420 16%A-44 7 4 20-132 11 54 35-109 416 16%BBB-1-159--42-62 10 274 10%合計698 137 208 203 187 151 132 125 105 101 279 2,440 92%BB-1--3-4 0%B-1$151$132$125$119$114$101$342$2676 100%担保タイプ別の公正価値単一三重住宅ローン商業 担保付きファミリーマート不動産融資(C)自動車事業TruPSレンタル鉄道レンタル航空機ローン売掛金総額1$504$267$49$44$187$151$132$125$63$106$39$268$1,935 87%2-1-159-42-62 10 274 12%小計504 268 49 203 187 151 132 125 105 101 278 2209 99%3-1--3--4 0%4-1--8--9 1%5--2--2 0%6保険会社総数$504$270$49$203$187$151$132$125$118$106$101$278$2224 100%非保険合計194 26 159--1 8-64 452合計$698$296$208$203$187$151$132$125$119$114$101$342$2,676(A)両機関が証券を格付けすれば, 上に示された格付けは、2つの格付けのうちの低い1つであり、3つ以上の機関が1つの証券を格付けする場合、表示される格付けは2番目に低い。(B)未格付け証券の87%がNAIC 1であり、12%が非保険会社が保有している。(C)担保融資とは、銀行融資、一戸建て賃貸物件、その他の商業融資及び賃貸を含む資産担保による私募融資協定をいう。26ページ目
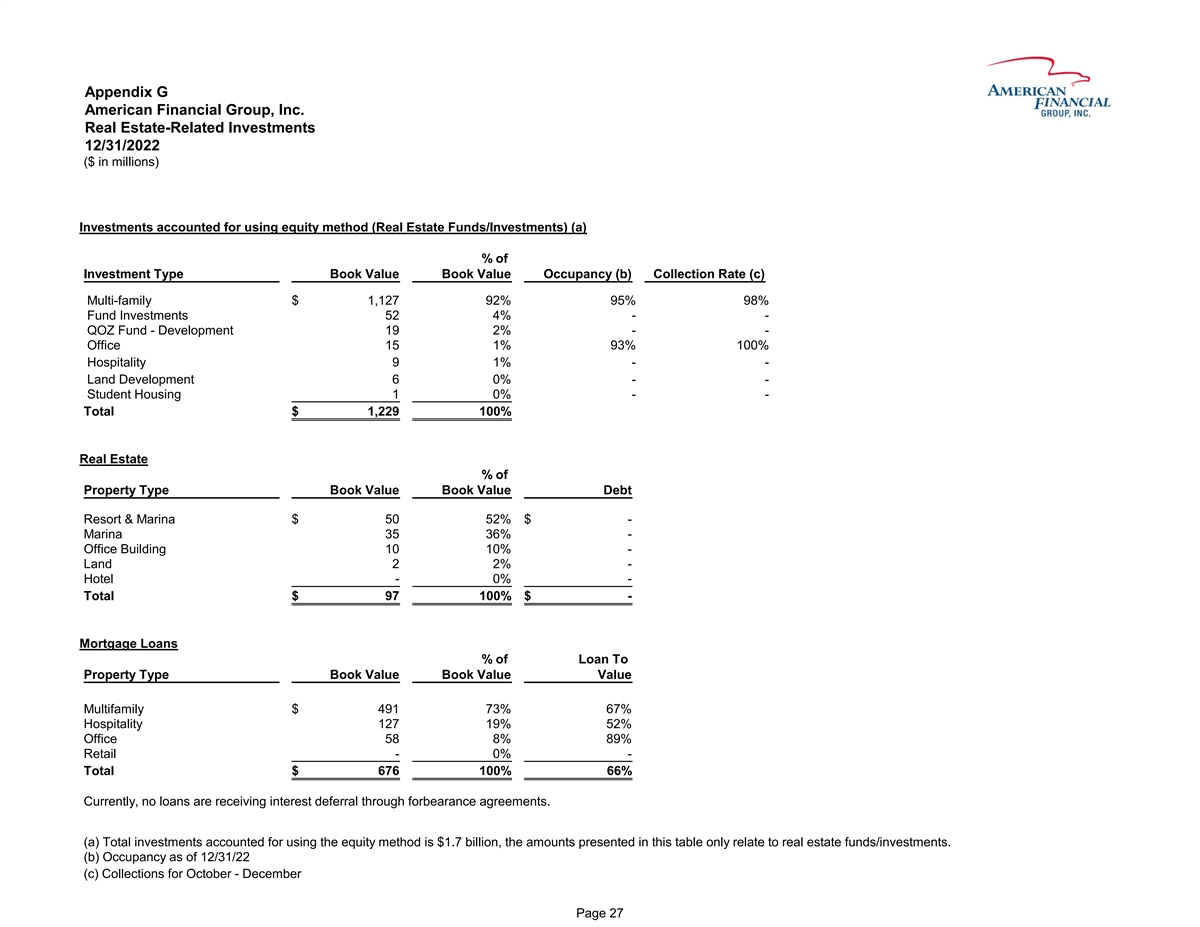
付録Gアメリカ金融グループは会社不動産関連投資(百万ドルで)(不動産ファンド/投資)(A)投資タイプの帳簿価値に占める割合(B)受取率(C)多世帯ファンド投資1,127 92%95%98%ファンド投資 52 4%−−QOZ基金開発19 2%−−オフィスビル15 1%93%100%ホテル業9 1%−土地開発6 0%−−学生住宅10%--合計$1,229 100%不動産タイプ帳簿価値%債務リゾートと埠頭$50 52%$- 埠頭35 36%-オフィスビル10 10%-土地2 2%-ホテル-0%-合計$97 100%$-担保融資%物件タイプ帳簿価値$491 73%67%ホテル業127 19%52%オフィスビル58 8%89%小売-0%-合計$676 100%66%現在、我慢協定で利息を得ることで延期されたローンは一つもありません。(A)権益法を用いて計算された投資総額は17億ドルであり、本表に示した金額は不動産 基金/投資のみに関連している。(B)2012年12月31日までの入居率(C)10月から12月までの収集量27ページ
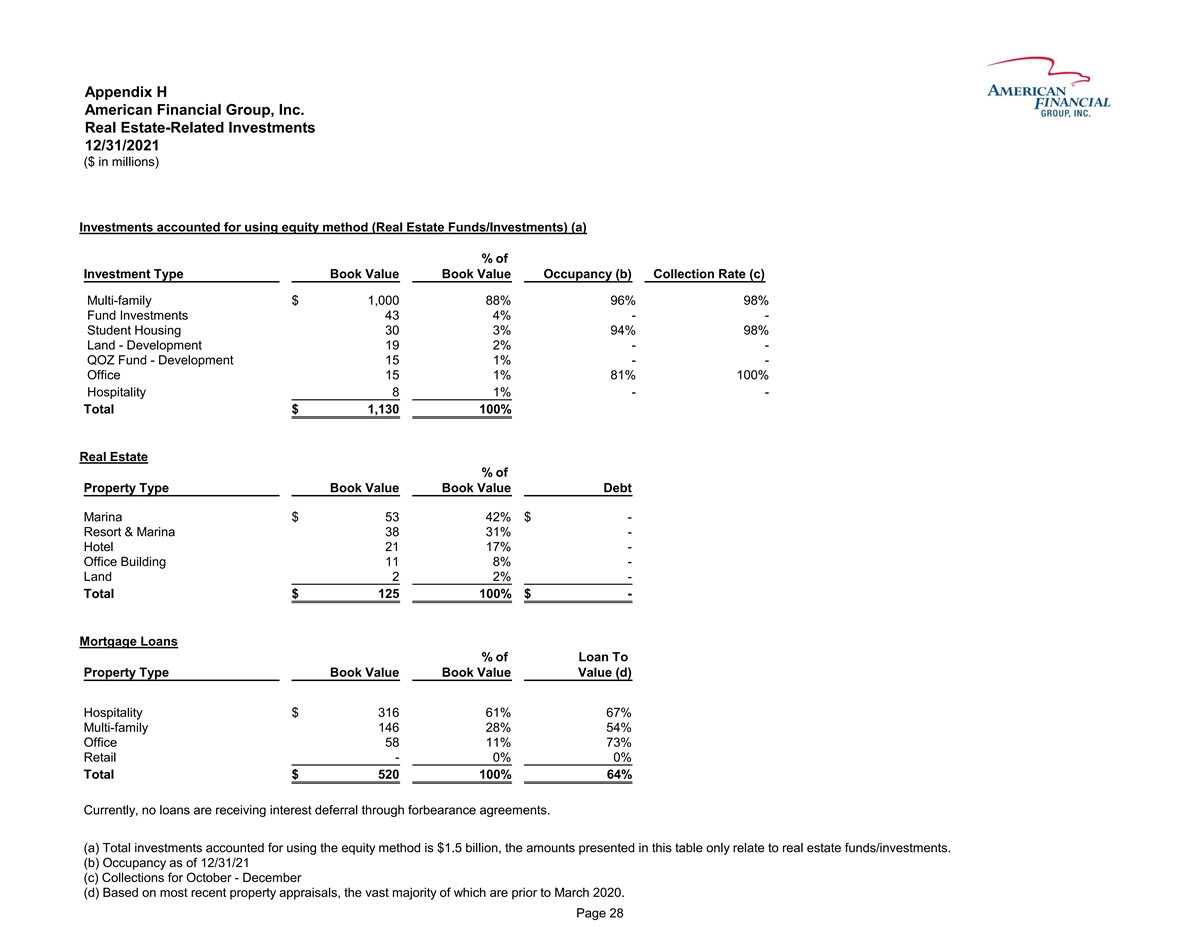
Appendix H American Financial Group, Inc. Real Estate-Related Investments 12/31/2021 ($ in millions) Investments accounted for using equity method (Real Estate Funds/Investments) (a) % of Investment Type Book Value Book Value Occupancy (b) Collection Rate (c) Multi-family $ 1,000 88% 96% 98% Fund Investments 43 4% - - Student Housing 30 3% 94% 98% Land - Development 19 2% - - QOZ Fund - Development 15 1% - - Office 15 1% 81% 100% Hospitality 8 1% - - Total $ 1,130 100% Real Estate % of Property Type Book Value Book Value Debt Marina $ 53 42% $ - Resort & Marina 38 31% - Hotel 21 17% - Office Building 11 8% - Land 2 2% - Total $ 125 100% $ - Mortgage Loans % of Loan To Property Type Book Value Book Value Value (d) Hospitality $ 316 61% 67% Multi-family 146 28% 54% Office 58 11% 73% Retail - 0% 0% Total $ 520 100% 64% Currently, no loans are receiving interest deferral through forbearance agreements. (a) Total investments accounted for using the equity method is $1.5 billion, the amounts presented in this table only relate to real estate funds/investments. (b) Occupancy as of 12/31/21 (c) Collections for October - December (d) Based on most recent property appraisals, the vast majority of which are prior to March 2020. Page 28