| 2023 年 3 月的讨论材料 |

| 议程 页 1 合并交易更新和行业背景 1 2 附录 10 |
| CNSL 公开市场概述 自 2021 年 1 月 1 日以来的股价表现(索引至 100) 来源:公司文件,截至 23 年 10 月 3 日的 Factset,华尔街研究 标准普尔500指数公开市场概述 当前价格(23 年 3 月 10 日)2.63 % 52 周高点 31.0% 已稀释已发行股票市值 117.8 310 美元以上:负债 2,283 美元减去:现金 (414) 加上:少数股权 8 Plus:优先股 477 公司价值 2,664 美元减去:未合并投资 (10) 调整后的公司价值 2,654 美元估值(街头)指标倍数 调整后的 FV /收入 CY2023E $,143 2.3x CY2024E 1,151 2.3x Adj FV/EBITDA(SBC 后) CY2023E 311 8.5x CY2024E 343 7.7x 杠杆 总负债/LTM 息税折旧摊销前利润(SBC 之前)384 4.9x br} 1 |

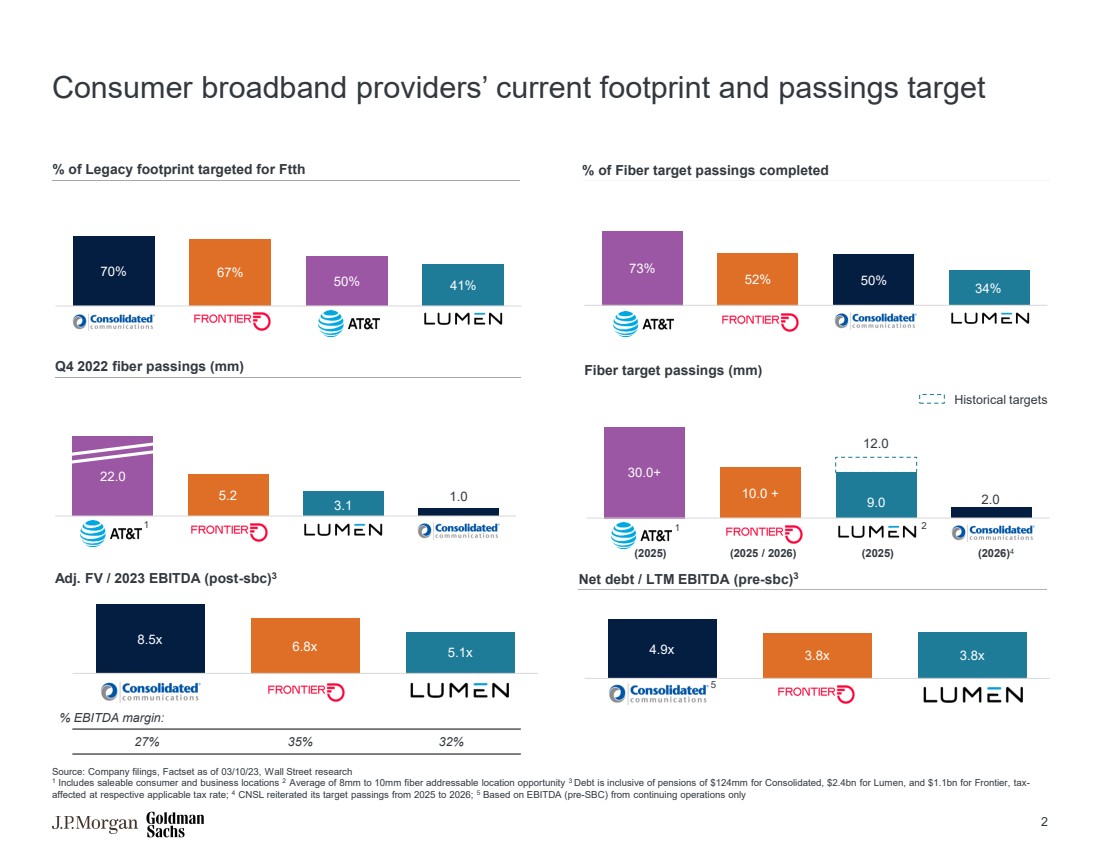
| 8.5x 6.8x 5.1x 消费宽带提供商当前的足迹和流向目标 调整后FV/2023 息税折旧摊销前利润(sbc 后) 3 净负债/LTM 息税折旧摊销前利润(sbc 之前) 3 22.0 5.2 1.0 1.0 2022 Q4 光纤通道 (mm) 30.0+ 9.0 2.0 Fiber 目标通过量 (mm) 27% 35% 32% % 息税折旧摊销前利润率: 70% 67% 50% 41% % 目标占传统足迹的 Ftth 73% 52% 34% % 已完成光纤目标通行比例 来源:公司文件,截至 23 年 3 月 10 日的 Factset,华尔街研究 1 包括可售信息消费者和商业地点 2 平均值800万至1000万美元的光纤寻址机会 3 债务包括合并后的1.24亿美元养老金、Lumen的24亿美元和Frontier的11亿美元养老金,按相应的适用税率计算受到税收影响;4 CNSL重申了2025年至2026年的目标;5 基于仅来自持续经营业务的息税折旧摊销前利润(SBC 之前) 4.9x 3.8 倍 1 1 历史目标 2 (2025) (2025/2026) (2026) 4 (2025) 5 2 |
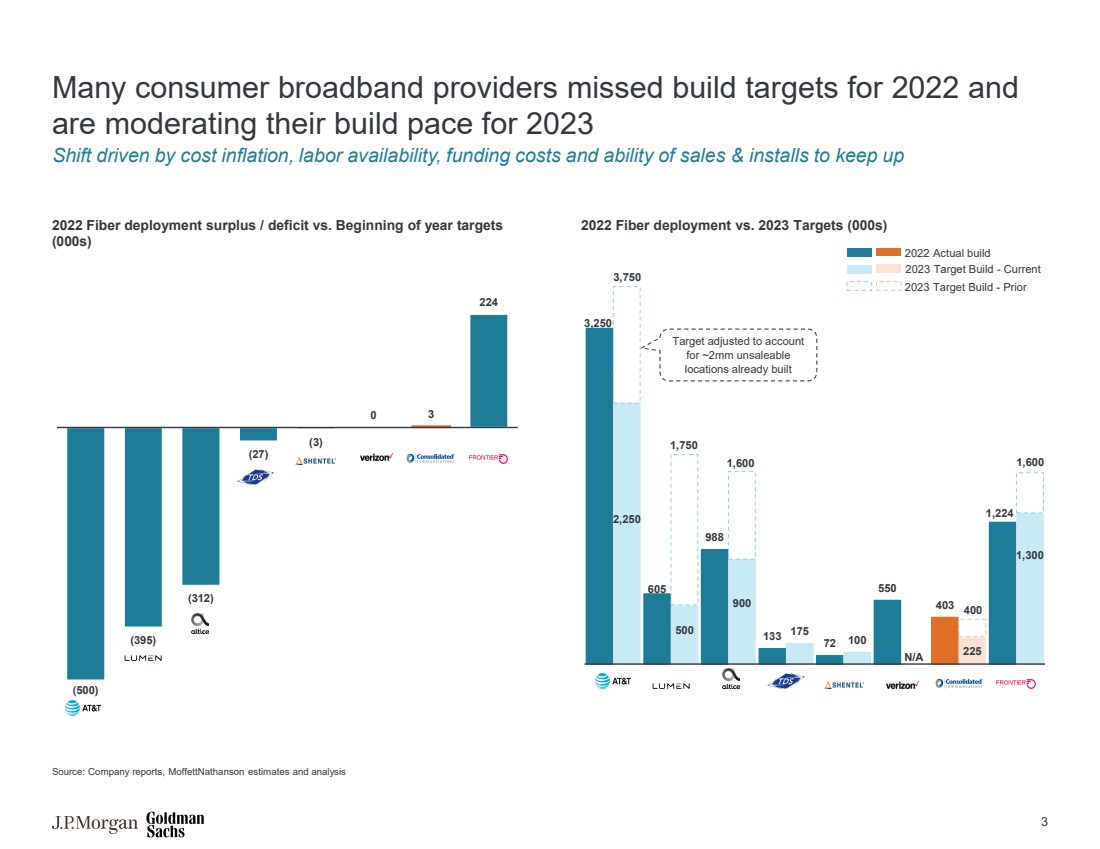
| 3,250 605 988 133 72 550 403 1,224 2,250 500 900 175 100 225 1,300 许多消费宽带提供商未能实现2022年的建设目标, 正在放缓2023年的建设步伐来源:公司报告,Moffettnathanson估计与分析 (000s) (395) (312) (27) (3) 0 3 224 转变是由成本上涨、劳动力可用性、资金成本以及销售和安装跟上步伐的能力 2022 年实际构建 1,600 N/A 2022 光纤部署与 2023 年目标的对比(000s) 2023 年目标构建-之前的 2023 年目标构建-当前 400 3,750 1,750 已对账户 进行了调整 已建成 位置 |
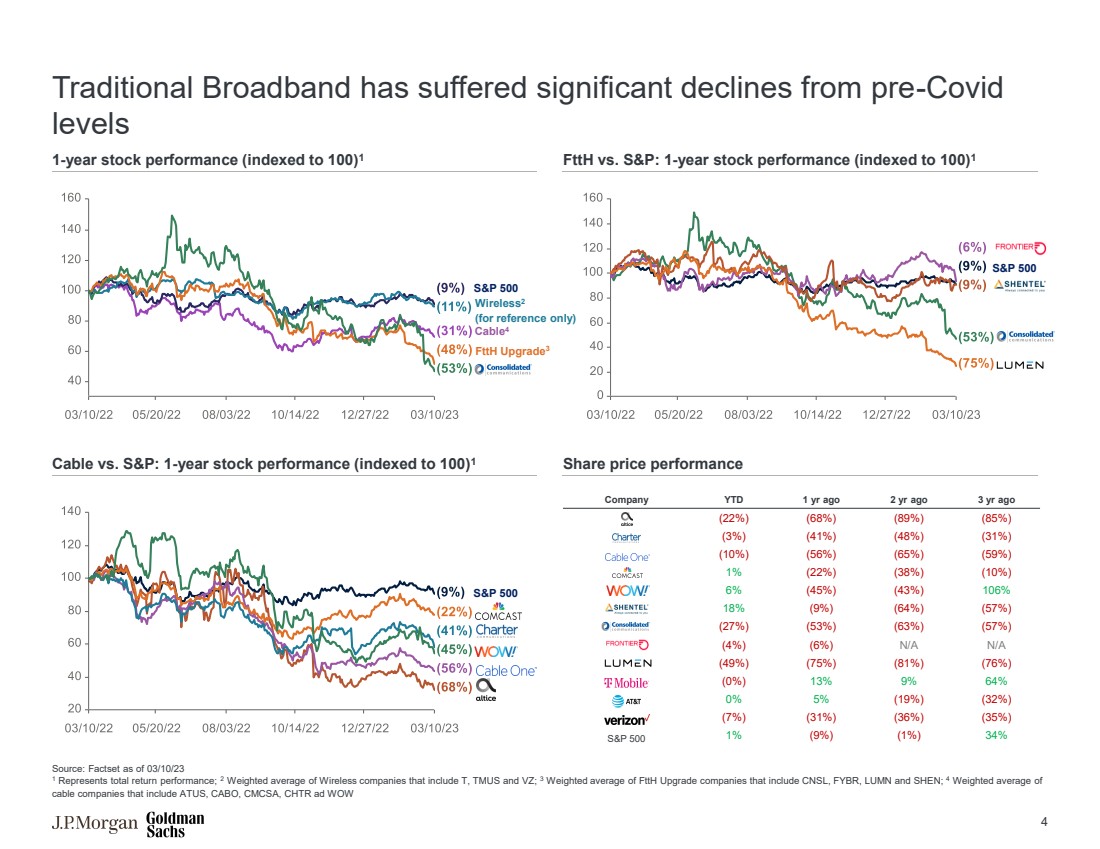
| 公司 YTD 1 年前 2 年前 3 年前 (22%) (68%) (89%) (85%) (3%) (41%) (48%) (31%) (10%) (56%) (65%) (59%) 1% (22%) (38%) (10%) 6% (45%) 106% } 18% (9%) (64%) (57%) (27%) (53%) (63%) (57%) (4%) (6%) N/A (49%) (75%) (81%) (76%) (0%) 13% 64% 0% (19%) (32%) (7%) (31%) (36%) (35%) 标准普尔500指数 1% (9%) (1%) 34% 传统宽带与新冠疫情之前的水平相比大幅下降 来源:截至 23 年 3 月 10 日 Factset 1 代表总回报业绩;2 无线公司的加权平均值,包括T、TMUS 和 VZ;3 包括CNSL、FYBR、LUMN和SHEN在内的FTTH升级公司的加权平均值;4 包括ATUS、CABO、CMCSA、CHTR和WOW 1年期股票表现(索引至100)1 ftth Upgrade3 标准普尔500 Cable4 ftth 对比标准普尔:1 年股票表现(索引至 100)1 标普500指数对比标准普尔:1 年股票表现(指数为 100)1 股价表现 标普500 4 Wireless2(仅供参考) |
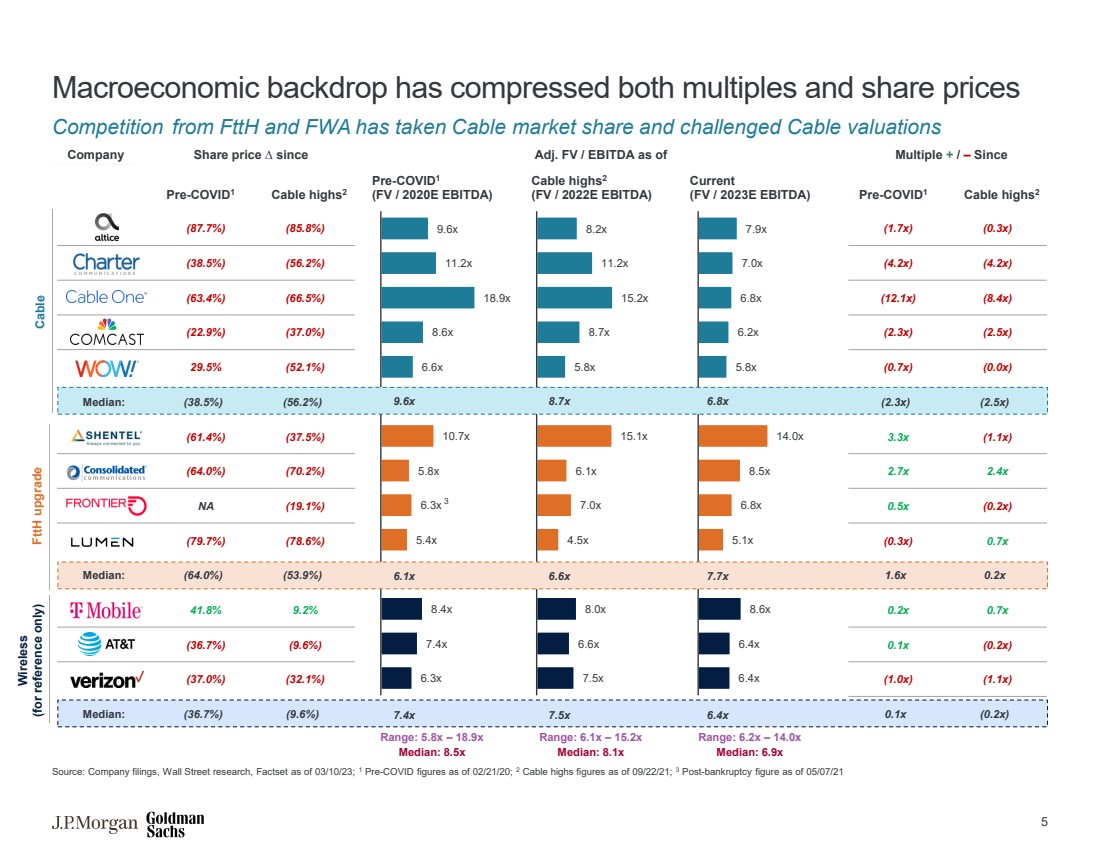
| 9.6x 11.2x 18.9x 8.6x 6.6x 10.7x 5.8x 5.4x 8.4x 7.4x 7.4x 6.3x 8.2x 8.7x} 5.8x 15.1x 6.1x 7.0x 4.5x 8.0x 6.6x 7.5x 7.9x 7.0x 6.8x 6.8x 6.8x 8.5x 6.8x 6.8x br} 5.1x 8.6x 6.4x 6.4x (87.7%) (85.8%) (38.5%) (56.2%) (63.4%) (66.5%) (22.9%) 中位数:(38.5%) (56.2%) (61.4%) (37.5%) (64.0%) (70.2%) NA (19.1%) (79.7%) (78.6%) 中位数:(64.0%) (53.9%) (53.9%) (36.7%) (9.6%) (37.0%) (32.1%) 中位数: (36.7%) (9.6%) 宏观经济背景压缩了倍数和股价 来自FTTH和FWA的竞争夺走了有线电视的市场份额并挑战了有线电视的估值 来源:公司文件,华尔街研究,截至23年10月21日的Factset;截至2020年2月21日的1份Covid前数字;截至21年9月22日的2份英镑破产后数字 05/07/21 Cable highs2 Cable ftTH 升级 调整后的股价— 15.2 倍 中位数:8.1 倍 范围:6.2 倍 — 14.0 倍 中位数:6.9 倍 Wireless (仅供参考) covid1 之前(FV/2020E 息税折旧摊销前利润) (FV/2020E 息税折旧摊销前利润) (FV/ 2023E 息税折旧摊销前利润) DA) 3 7.4x 7.5x 6.4x 6.1x 6.6x 7.7x 9.6x 8.7x 6.8x (1.7x) (0.3x) (4.2x) (4.2x) (12.1x) (8.4x) (2.3x) (0.7x) (0.0x) (2.3x) (2.5x) 3.3x (1.1x) 2.7x 2.4x 0.5x (0.2x) (0.3x) 0.7x 1.6x 0.2x 0.7x 0.1x (0.2x) (1.0x) (1.1x) 0.1x (0.2x) 5 |
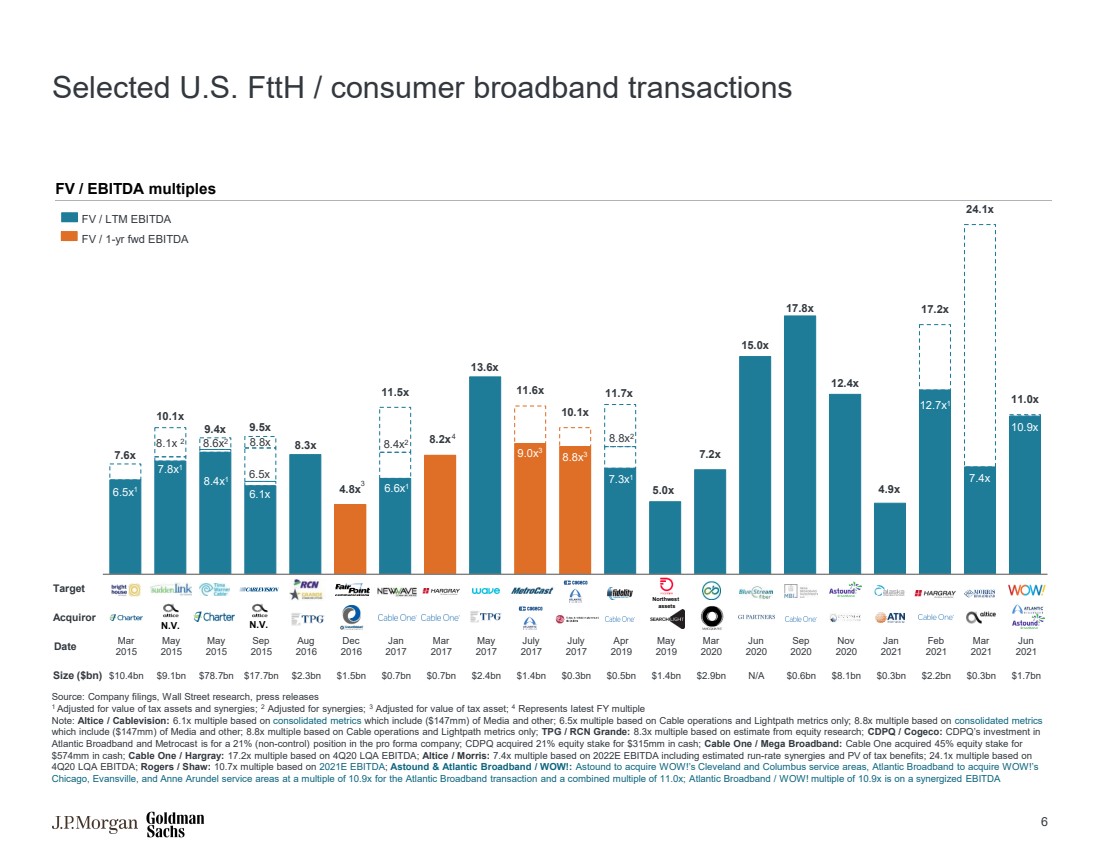
| 部分美国 FTTH /消费者宽带交易 6 7.8x1 8.4x1 12.7x1 6.5x1 7.3x1 8.1x 2 7.6x 10.1x 9.4x 9.5x 8.3x 4.8x 8.2x 13.6x 10.6x 10.6x 1x 11.7x 5.0x 7.2x 15.0x 17.8x 12.4x 4.9x 24.1x 11.0x 11.0x 目标 2015 年 3 月 2015 年 5 月 2016 年 8 月 2016 年 12 月 2017 年 3 月 2017 年 5 月 2017 年 7 月 2017 年 7 月 2019 年 5 月 2020 年 6 月 2020 年 9 月 2020 年 11 月 2021 年 2 月 2021 年 6 月 尺寸 (亿美元) 10.4 美元bn 91亿美元 787亿美元 27亿美元 23亿美元 15亿美元 7亿美元 24亿美元 14亿美元 14亿美元 14亿美元 29亿美元 N/A 6亿美元 81亿美元 3亿美元 22亿美元 17亿美元 N.V. N.V. 来源:公司文件、华尔街研究、新闻稿 1 根据税收资产价值进行了调整以及协同效应;2 经协同效应调整;3 根据税收资产价值进行了调整;4 代表最新的财年倍数 注:Altice/Cablevision:6.1 倍倍数基于合并指标,其中包括(1.47 亿美元)媒体和其他数据;6.5 倍数仅基于有线电视业务和 Lightpath 指标;8.8 倍数基于合并指标 ,包括(1.47亿美元)媒体和其他指标;8.8倍数仅基于有线电视运营和Lightpath指标;TPG/RCN Grande:基于股票研究估计的8.3倍;CDPQ/Cogeco:CDPQ对 大西洋宽带和Metrocast的投资为这家预估公司的21%(非控制权)头寸;CDPQ收购了21% 股权以3.15亿美元现金获得;有线一号/超级宽带:有线一号以 5.74亿美元现金收购了45%的股权;Cable One/Hargray:根据2020年第四季度的LQA息税折旧摊销前利润,倍数为17.2倍;Altice/Morris:7.4倍倍数基于2022年度息税折旧摊销前利润,包括估计的运行率协同效应和税收优惠的PV;基于 4QA 息税折旧摊销前利润的24.1倍;罗杰斯/肖:基于2021年息税折旧摊销前利润的10.7倍;Astound & Atlantic Broadband/WOW!: 收购 WOW 真是令人震惊!”s 克利夫兰和哥伦布服务区,大西洋宽带将收购 WOW!”s 大西洋宽带交易的芝加哥、埃文斯维尔和安妮·阿伦德尔服务区的倍数为10.9倍,合并倍数为11.0倍;大西洋宽带/哇!协同息税折旧摊销前利润 FV/EBITDA 倍数 N.V. 8.8x 6.5x 6.1x FV/1 年期远期息税折旧摊销前利润 7.4x 12.7x1 FV/LTM 息税折旧摊销前利润 8.8x2 8.8x 9.0x 3 3 8.4x2 6.6x1 8.6x2 8.4x1 西北 资产 4 3 |
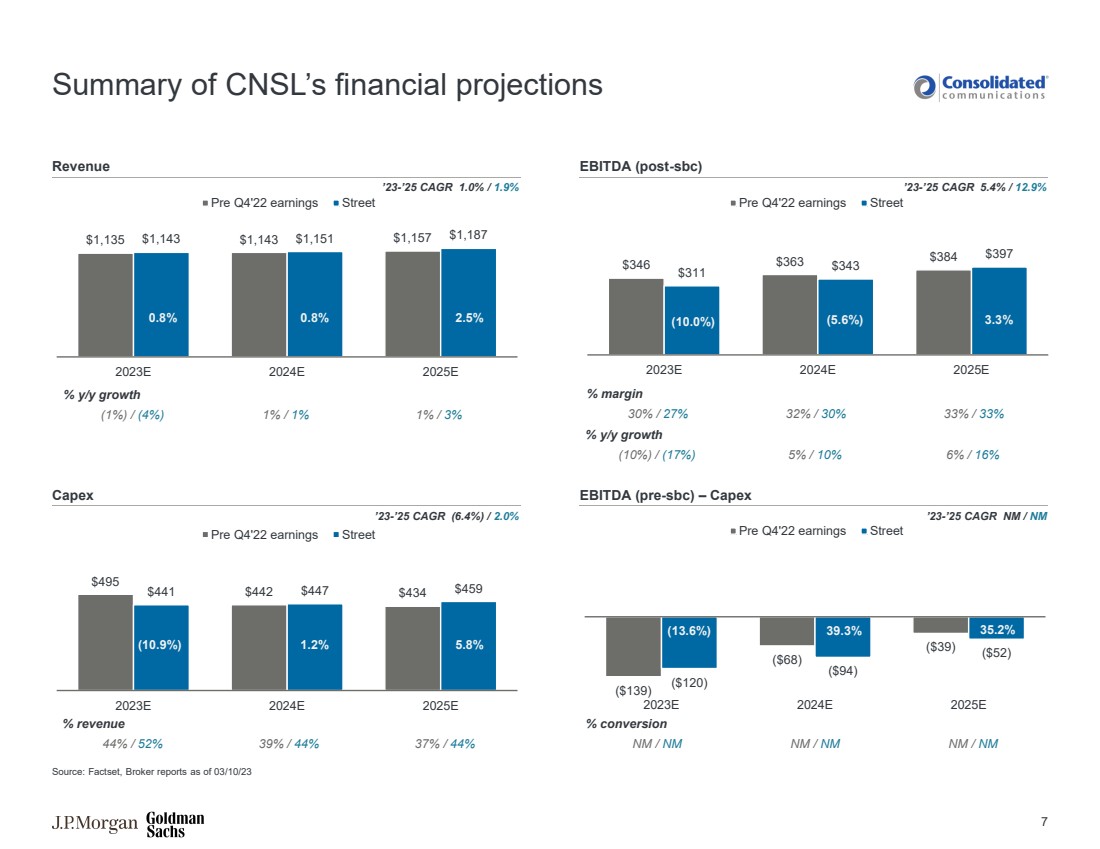
| % 转换 NM/NM NM/NM /NM 1,135 美元 1,143 美元 1,143 美元 1,157 美元 1,187 美元 2023E 2024E 2025E 22 年第四季度前财报 495 美元 441 美元 434 美元 2023 年 2024E 2025E 收入息税折旧摊销前利润(post-sbc) 资本支出息税折旧摊销前利润(sbc 之前)— 资本支出 % 同比增长 (1%) 1%/1% 1%/3% % 收入 44%/52% 39%/44% 346 363 美元 311 343 美元 2023E 2025E 22 年第四季度前财报 % 利润率 30%/27% 32%/30% 33%/33% CNSL 财务预测摘要 % 同比增长 % (10%)/(17%) 5%/10% 6%/16% 来源:Factset,经纪商报告截至23年10月3日 '23-'25 复合年增长率 1.0%/1.9% '23-'25 复合年增长率 5.4%/12.9% '23-'25 复合年增长率 (6.4%)/2.0% '23-'25 复合年增长率 NM/NM 0.8% 2.5% (10.9%) 1.2% (10.9%) 10.0%) (5.6%) 3.3% (139 美元) (68 美元) (39 美元) (120 美元) (94 美元) (52 美元) 2023E 2024E 2025E 22 年第四季度前财报 (13.6%) 39.3% 35.2% 7 |
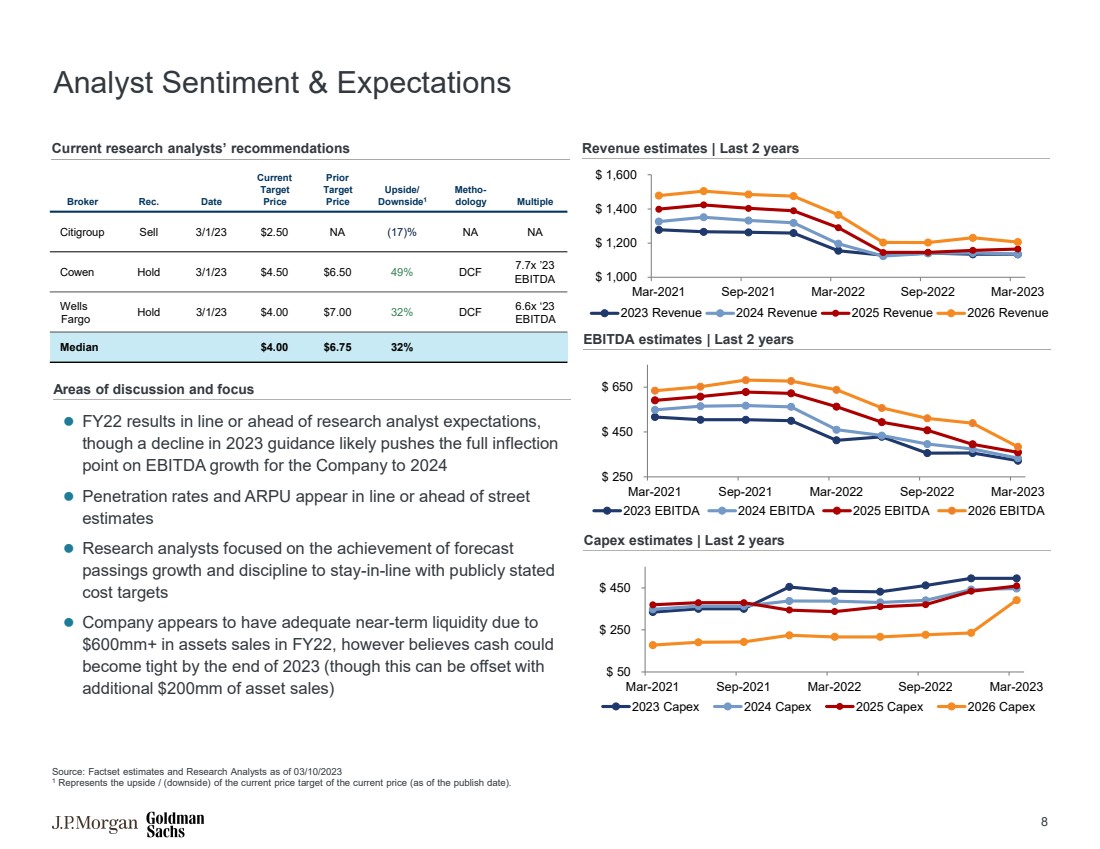
| 讨论和关注领域 分析师情绪与预期 收入估计 | 过去 2 年 EBITDA 估计 | 过去 2 年 资本支出估计 | 过去 2 年 ⚫ 2022 财年的业绩符合或超过研究分析师的预期, 尽管2023年指引的下降可能会将公司息税折旧摊销前利润增长的全部拐点推至2024年 ⚫ 渗透率和ARPU出现排队或超前估计 估计 ⚫ 研究分析师专注于预测的实现情况 通过增长和纪律来公开保持一致既定的 成本目标 ⚫ 由于 2022 财年资产销售额超过 6 亿美元,公司似乎有足够的短期流动性,但他们认为 到 2023 年底现金可能变得紧张(尽管这可以被 额外的 2 亿美元资产出售所抵消) 当前研究分析师的建议 来源:截至2023年10月3日Factset的估计和研究分析师 1 代表当前价格(截至发布日期)当前价格目标的上行/(下行空间)。 Broker Rec.日期 当前 目标 价格 Prior 目标 价格 上行/ 下行1 Metho-dology 倍数 花旗集团卖出 23 年 3 月 1 日 2.50 美元 NA Cowen Hold 3 月 1 日 4.50 美元 49% DCF 7.7x '23 息税折旧摊销前利润 Fars Go Hold 23 年 3 月 4 美元 7.00 美元 32% DCF 6.6x '23 息税折旧摊销前利润 中位数 4.00 美元 6.75 美元 32% 美元 50 美元 250 美元 450 美元 2021 年 3 月 2022 年 3 月 2022 年 9 月 2023 月 2023 年资本支出 2025 年资本支出 美元 450 美元 2021 年 3 月 2022 年 9 月 2022 年 3 月 -2023 年息税折旧摊销前利润 2024 年息税折旧摊销前利润 2026 息税折旧摊销前利润 $1,000 美元 1,200 美元 1,400 美元 2021 年 3 月2021 年 9 月 2022 年 3 月 2022 年 9 月 2023 年收入 2024 年收入 2025 年收入 2026 年收入 8 |
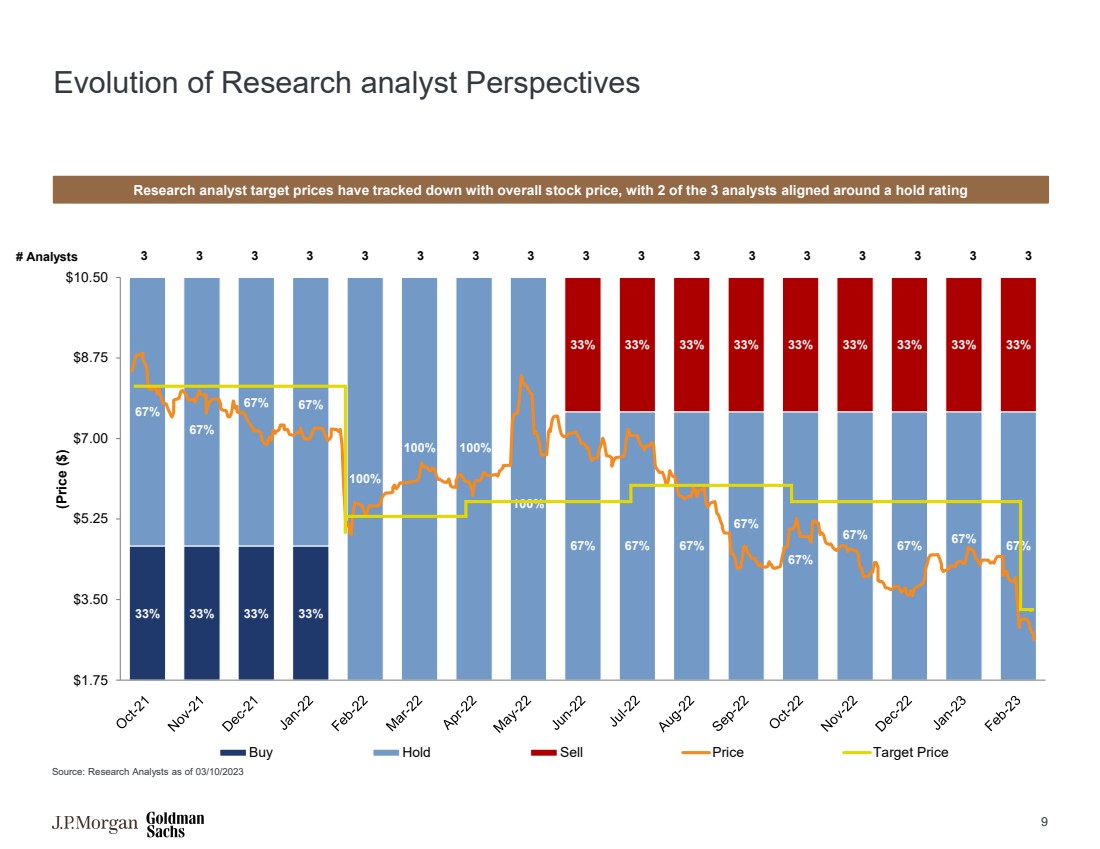
| 研究分析师视角的演变 研究分析师的目标价格已追踪到整体股价,三位分析师中有两位持有评级 来源:截至2023年10月3日,研究分析师 3 3 3 3 3 3 3 3 3 3 33% 33% 33% 67% 67% 67% 100% 100% 100% 100% 67% 67% 67% 67% 67% 67% 67% 33% 33% 33% 33% 33% 33% 33% 33% 33% 1.75 美元 3.50 美元 5.25 美元 7.00 美元 8.75 美元 10.50 美元(价格($) 买入持有卖出价目标价格 9 |
| 议程 页 1 合并交易更新和行业背景 1 2 附录 10 |
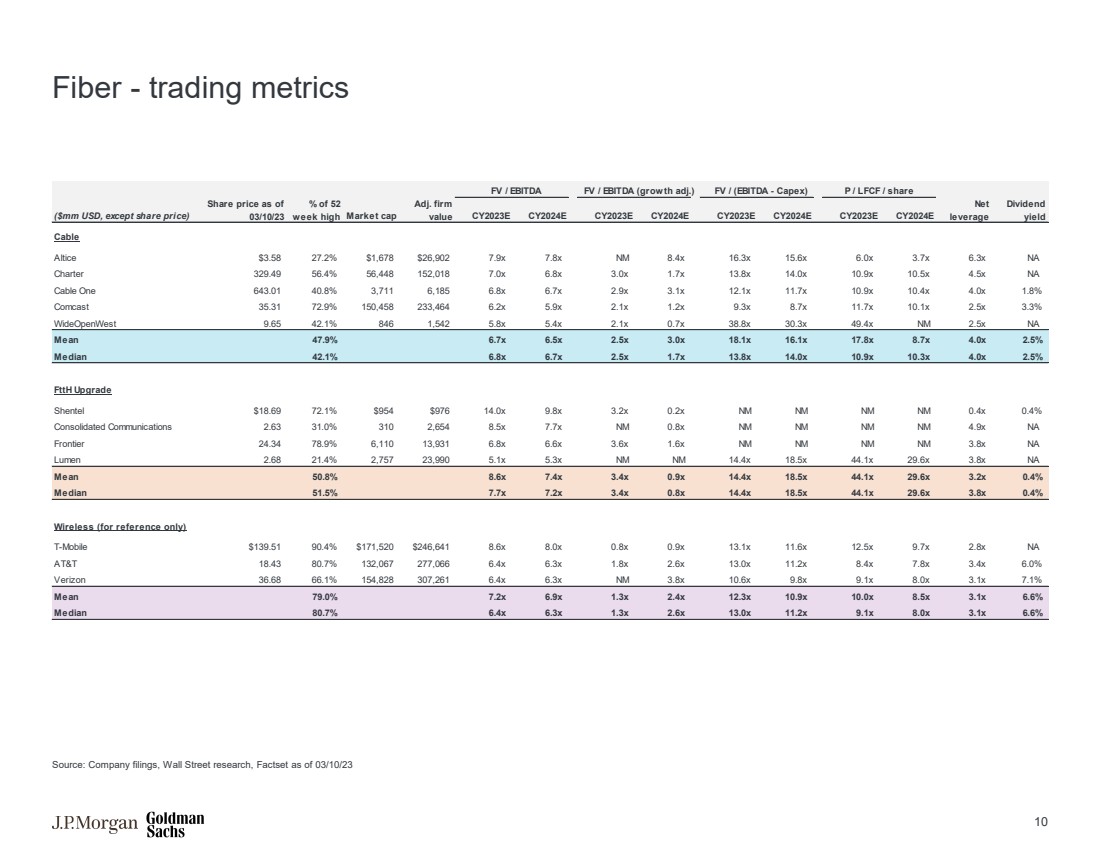
| 光纤——交易指标 FV/EBITDA FV/EBITDA(增长调整后)FV/(息税折旧摊销前利润——资本支出)P /LFCF /股票 (百万美元,股价除外) 截至 03/10/23 周最高市值的百分比 调整公司 价值 CY2023E CY2024E CY2023E CY2024E CY2023E CY2024E CY2023E CY2024E 杠杆 股息 收益率 27.58 27.2% 1,678 美元 26,902 美元 7.9 倍 7.8 倍 NM 8.4 x 16.3 x 15.6x 6.0x 3.7 x 6.3x NA Charter 329.49 56.49 56,448 152,018 7.0x 6.0x 1.7x 13.8x 14.0x 10.5 x 4.5x NA Cable One 643.01 40.8% 3,711 6,185 6.8x 6.7x 2.9x 3.1x 12.1x 11.7x 10.9x 10.4x 4.0x 1.8% 康卡斯特 35.31 72.9% 150,458233,464 6.2x 5.9x 2.1x 1.2x 9.3x 8.7x 11.7x 10.1x 2.5x 3.3% WideOpenWest 9.65 42.1% 846 1,542 5.8x 5.4x 2.1x 0.7x 38.8x 30.3x 49.4x NA 平均值 47.9% 6.7x 2.5x 3.5x 18.1x 16.1x 17.8x 8.7x 4.0x 2.5% 中位数 42.1% 6.8x 6.7x 2.5x 1.7x 13.8x 14.0x 10.9x 10.3x 4.0x 2.5% ftth Upgrade Shentel 18.69 美元 976 美元 14.0x 9.8x 0.2x NM 0.4x 0.4% 联合通讯 2.63 31.0% 310 2,654 8.5x 7.7x NM 0.8x NM NM NM NM 4.9x NA Frontier 24.34 78.9% 6,110 13,931 6.6x 3.6x 1.6x NM NM NM 3.8x NA Lumen 2.68 21.4% 275723,990 5.1x 5.3x NM 14.4x 18.5x 44.1x 29.6x 3.8x NA 平均值 50.8% 8.6x 7.4x 3.4x 0.9x 14.4x 18.5x 44.1x 29.6x 3.2x 0.4% 中位数 51.5% 7.7x 3.4x 0.8x 14.5x 44.1x 29.5x 6x 3.8x 0.4% Wireless(仅供参考) T-Mobile 139.51 美元 90.4% 美元 171,520 美元 246,641 8.6x 8.0x 0.9x 13.1x 11.6x 12.5x 9.7x 2.8x NA AT&T 18.43 80.7% 132,067 277,066 6.4x 6.3x 2.66 x 13.0x 11.2x 8.4x 7.8x 3.4x 6.0% Verizon 36.68 66.1% 154,828 307,261 6.4x 6.3x NM 3.8x 9.8x 9.8x 9.1x 8.1x 7.1% 平均值 79.0% 7.2x 6.9x 1.3x 2.4x 10.0x 8.5x x 3.1x 6.6% 中位数 80.7% 6.4x 6.3x 1.3x 2.6x 13.0x 11.2x 9.1x 8.0x 3.1x 6.6% 来源:公司文件,华尔街研究,截至 23 年 3 月 10 日 Factset 10 |
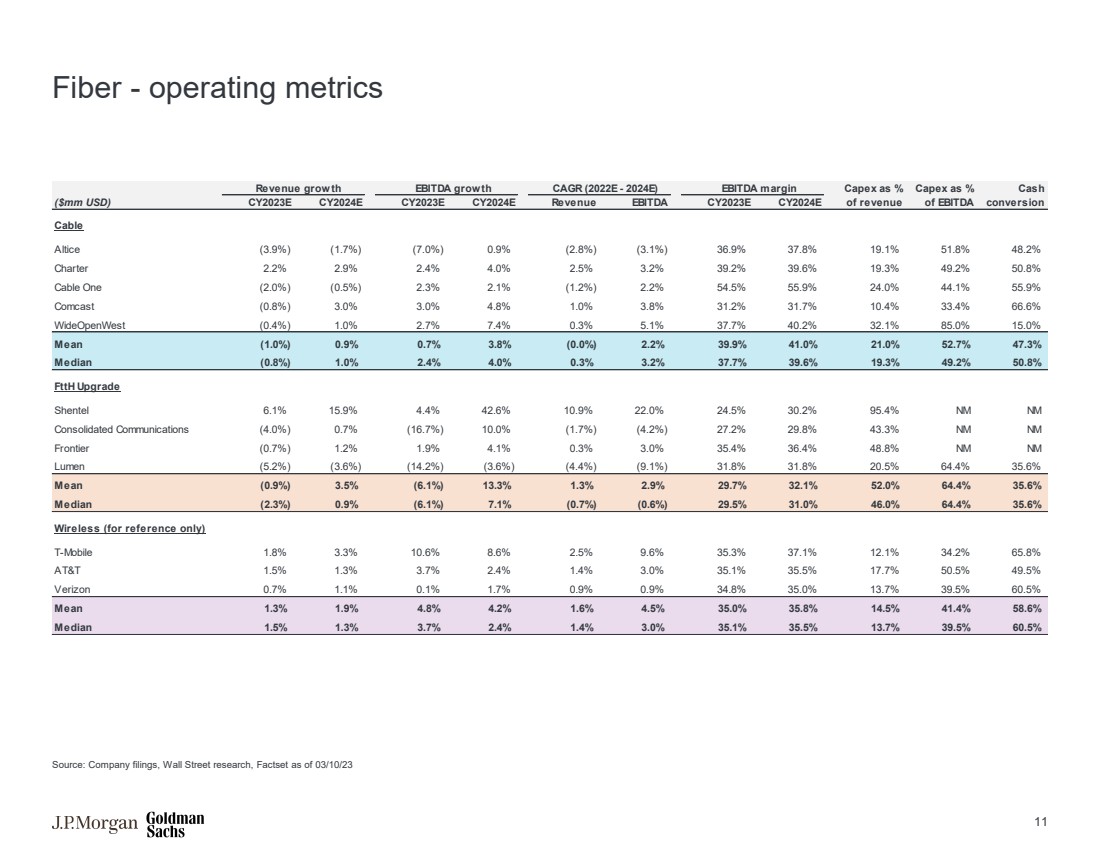
| 光纤——运营指标 来源:公司文件、华尔街研究、截至 23 年 3 月 10 日的 Factset 收入增长息税折旧摊销前利润增长复合年增长率(2022E-2024E)息税折旧摊销前利润率资本支出百分比资本支出百分比现金 (百万美元)CY2023E CY2024E CY2023E CY2024E 收入息税折旧摊销前利润率 CY2023E CY2024E 1.7%) (7.0%) 0.9% (2.8%) (3.1%) 36.9% 37.8% 19.1% 51.8% 48.2% Charter 2.2% 2.9% 4.0% 2.5% 3.2% 39.2% 39.6% 19.3% 49.2% 50.8% Cable One (2.0%) (0.5%) 2.3% 2.1% (1.2%) 2.2% 54.9% 24.0% 44.1% 55.9% 康卡斯特 (0.8%) 3.0% 3.0% 4.8%1.0% 3.8% 31.2% 31.7% 10.4% 33.4% 66.6% WideOpenWest (0.4%) 1.0% 2.7% 7.4% 0.3% 37.7% 40.2% 32.1% 85.0% 15.0% 平均值 (1.0%) 0.9% 3.8% (0.0%) 2.2% 39.9% 41.0% 52.7% 47.3% 中位数 (0.8%) 1.0% 0% 2.4% 4.0% 0.3% 3.2% 37.7% 39.6% 19.3% 49.2% 50.8% FTTH Upgrade Shentel 6.1% 15.9% 4.4% 42.6% 10.0% 24.5% 95.4% NM (0.7%) 1.2% 1.9% 4.1% 0.3% 3.0% 35.4% 36.4% 48.8% NM Lumen (5.2%) (3.6%) (14.2%) (3.2%) (3.6%) (3.6%) (4.4%) (9.1%) 31.8% 31.8% 20.5% 64.4% 35.6% 平均值 (0.9%) 3.5% (6.1%) 13.3% 2.9% 29.7% 32.1% 52.0% 64.4% 35.6% 中位数 (2.3%) 0.9% (6.1%) 7.1% (0.7%) 29.5% 31.0% 46.0% 64.4% 35.6% 无线(仅供参考) T-3% 手机 1.8% 3.3% 10.6% 8.6% 2.5% 9.6% 35.3% 37.1% 12.1% 34.2% 65.8% AT&T 1.5% 1.3% 3.7% 2.4% 1.0% 35.1% 35.5% 17.7% 50.5% 49.5% Verizon 0.7% 0.7% 0.9% 34.8% 13.7% 39.5% 60.5% Mean 3% 1.9% 4.8% 4.2% 1.6% 4.5% 35.0% 35.8% 14.5% 41.4% 58.6% 中位数 1.5% 1.3% 3.7% 2.4% 1.4% 3.0% 35.1% 35.5% 13.7% 39.5% 60.5% 11 |
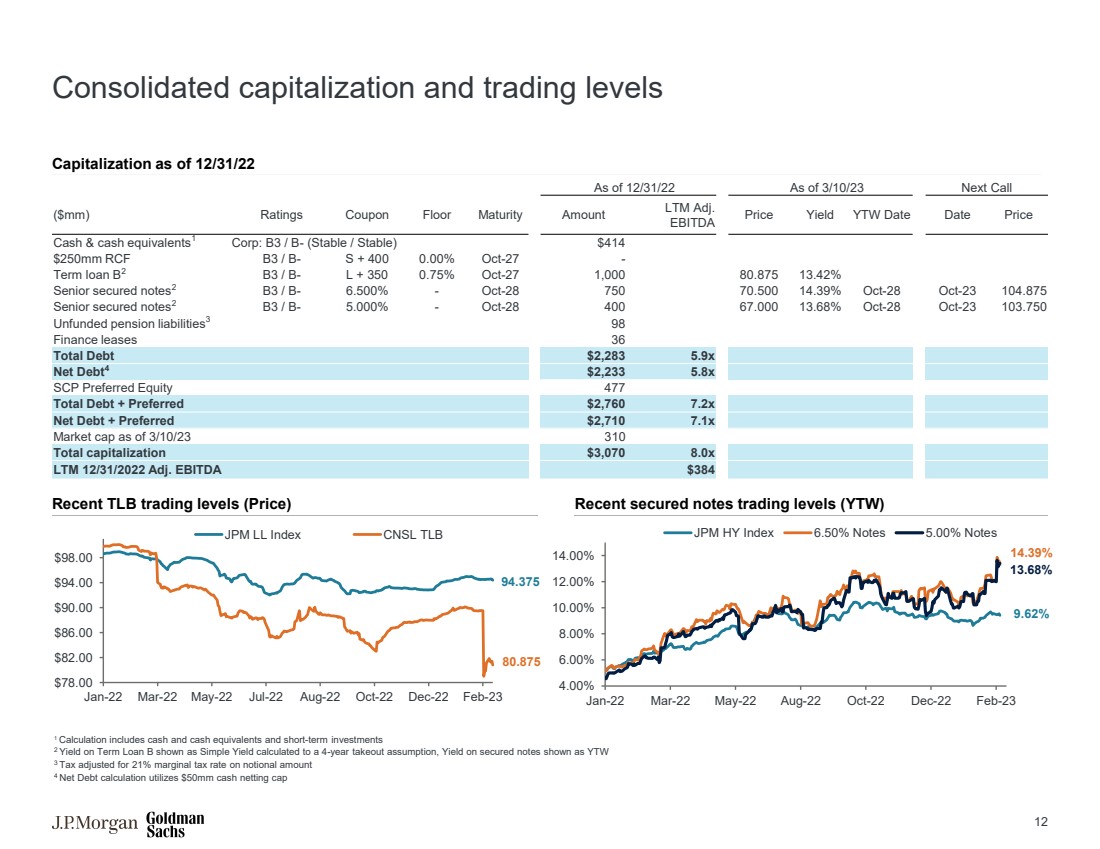
| 合并资本和交易水平 最近的 TLB 交易水平(价格)最近的有担保票据交易水平(YTW) 截至 22 年 12 月 31 日的资本化 1 计算包括现金和现金等价物以及短期投资 2 按照 4 年收回假设计算的简单收益率,有担保票据的收益率显示为 YTW 3 经税收调整后的名义金额边际税率 4 净负债计算使用了 5000 万美元的现金净额上限 截至 23 年 3 月 10 日,下次电话会议 ($mm) 评级息息底限到期金额LTM Adj. 息税折旧摊销前利润价格收益率截至日期价格 现金及现金等价物1 公司:B3/B-(稳定/稳定)4.14 美元 2.5 亿美元 RCF B3/B-S + 400 0.00% 10 月 27 日- 定期贷款 B2 B3/B-L + 350 0.75% Oct-27 1,000 80.875 13.42% br} 优先担保票据 2 B3/B-6.500% — 10 月 28 日 750 750 70.500 14.39% 10 月 28 日 104.875 优先担保票据2 B3/B-5.000% — 10 月 28 日 400 67.000 13.68% 10月28 日 103.750 无准备金的养老金负债 3 98 融资租赁 36 债务总额 2,283 5.9 倍 净负债 4,233 美元 5.8 倍 SCP 优先股权总额 477 美元 + 优先股 2,760 美元 7.2 倍 净额债务 + 优先股 2710 美元 7.1 倍 截至 23 年 3 月 10 日 310 日总市值 310 总市值 3,070 美元 8.0 倍 LTM 2022 年 12 月 31 日调整后息税折旧摊销前利润 384 美元 86.00 美元 98.00 美元 1 月 22 日 3 月 22 日 7 月 22 日 8 月 22 日 12 月 22 日 JPM LL 指数 CNSL TLB 4.00% 6.00% 8.00% 10.00% 12.00% 1月22日5月22日8月22日10月22日摩根大通纽约股市指数 6.50% 票据 5.00% 票据 80.875 94.375 14.39% 9.62% } 13.68% 12 |
| 免责声明 本演示文稿专为直接向其发送和交付的摩根大通客户(包括该客户的子公司,简称 “公司”)的利益和内部使用而编写 ,目的是协助公司初步评估一项或多项可能交易的可行性,不具有向任何其他方发布或披露全部或部分的权利。本演示文稿仅供讨论之用,在未提及摩根大通提供的口头简报的情况下不完整,应仅与之一起观看。 未经摩根大通事先书面同意,本演示文稿及其任何内容均不得披露或用于任何其他目的。 本演示文稿中的信息基于管理层提供给我们的任何预测,反映了当前情况和我们截至该日期的观点,所有这些都可能相应地受 的变动。摩根大通的意见和估计构成摩根大通的判断,应被视为指示性、初步性且仅用于说明目的。在准备本演示文稿时, 我们在未经独立核实的情况下依赖并假设所有来自公共来源的信息、由 公司或代表公司提供给我们或以其他方式经过我们审查的所有信息的准确性和完整性。此外,我们的分析不是也不旨在评估公司或任何其他实体的资产、股票或业务。 摩根大通不对交易可能获得的实际价值或完成交易所产生的法律、税务或会计影响作出陈述。除非 在此明确考虑,否则本演示文稿中的信息未考虑可能的一笔或多笔涉及实际或潜在控制权变更的交易的影响, 可能产生重大估值和其他影响。 尽管有相反的规定,但公司及其每位员工、代表或其他代理人均可向任何和所有人披露本文所考虑的交易的美国 联邦和州所得税待遇以及美国联邦和州所得税结构,以及向公司提供的与此类税收待遇和税收结构有关的所有种类的材料(包括意见或其他税务 分析)只要这种待遇和/或结构与美国联邦政府有关,或摩根大通向 公司提供的州所得税策略。摩根大通的数据隐私政策可在以下网址找到:http://www.jpmorgan.com/pages/privacy。 摩根大通是美国证券交易委员会研究和解协议的当事方,因此,通常不允许利用该公司的研究能力来推销投资银行业务。本演示文稿中包含的所有观点 均为摩根大通投资银行的观点,而不是研究部的观点。摩根大通的政策禁止员工直接或间接向标的公司提供有利的 研究评级或特定价格目标,或提议更改评级或价格目标,以此作为获得业务或补偿的对价或诱惑。摩根大通 还禁止其研究分析师因参与投资银行交易而获得报酬,除非此类参与旨在使投资者受益。 银行同业拆借利率(iBOR)和其他基准利率的变化:某些利率基准正在或将来可能会成为现行国际、国家和其他监管指导、改革和改革提案。欲了解更多信息,请咨询:https://www.jpmorgan.com/global/disclosures/interbank_offered_rates JPMorgan 大通银行及其关联公司不提供税务建议。因此,本文所包含的关于美国税务事宜(包括任何附件)的任何讨论均无意使用或使用 与摩根大通无关的任何人对本文所述任何事项的促销、营销或推荐,也不得用于逃避美国税务相关处罚。 摩根大通是摩根大通及其全球子公司和分支机构投资业务的营销名称。证券、银团贷款安排、财务咨询、贷款、 衍生品以及其他投资银行和商业银行业务活动由摩根大通证券有限责任公司、摩根大通证券有限公司、摩根大通证券有限公司、摩根大通证券有限公司、摩根大通 北卡罗来纳州大通银行以及摩根大通在全球范围内获得适当许可的子公司和分支机构共同开展。摩根大通交易团队成员可能是上述任何实体的员工。 摩根大通证券有限公司由审慎监管局授权,受金融行为监管局和审慎监管局监管。摩根大通证券交易所被德国联邦金融监管局(Bundesanstalt für Finanzdienstleistungsaufsicht,BaFin)授权为信贷机构,并由联邦金融监管局、德国中央银行 (德意志联邦银行)和欧洲中央银行(ECB)共同监管。 有关摩根大通德国任何法律实体的信息,请参阅:https://www.jpmorgan.com/country/US/en/disclosures/legal-entity-information#germany。 有关摩根大通任何其他法律实体的信息,请参阅:https://www.jpmorgan.com/country/GB/EN/disclosures/investment-bank-legal-entity-disclosures。 JPMS LLC根据1934年《证券 交易法》第15a-6条,在适当时由其非美国关联公司为美国客户或与其美国客户进行的中间证券交易。请咨询:www.jpmorgan.com/securities-transactions 本演示文稿不构成任何摩根大通实体对承保、认购或配售任何证券、延长或安排信贷或提供任何其他服务的承诺。 2022 摩根大通版权所有版权所有。摩根大通银行,北卡罗来纳州,根据美国法律成立,责任有限。 |
| These materials have been prepared and are provided by Goldman Sachs on a confidential basis solely for the information and assistance of the Board of Directors and senior management of Searchlight Capital (the "Company") in connection with its consideration of the matters referred to herein. These materials and Goldman Sachs’ presentation relating to these materials (the “Confidential Information”) may not be disclosed to any third party or circulated or referred to publicly or used for or relied upon for any other purpose without the prior written consent of Goldman Sachs. The Confidential Information was not prepared with a view to public disclosure or to conform to any disclosure standards under any state, federal or international securities laws or other laws, rules or regulations, and Goldman Sachs does not take any responsibility for the use of the Confidential Information by persons other than those set forth above. Notwithstanding anything in this Confidential Information to the contrary, the Company may disclose to any person the US federal income and state income tax treatment and tax structure of any transaction described herein and all materials of any kind (including tax opinions and other tax analyses) that are provided to the Company relating to such tax treatment and tax structure, without Goldman Sachs imposing any limitation of any kind. The Confidential Information has been prepared by Goldman Sachs Investment Banking and is not a product of Goldman Sachs Global Investment Research. Goldman Sachs and its affiliates are engaged in advisory, underwriting and financing, principal investing, sales and trading, research, investment management and other financial and non-financial activities and services for various persons and entities. Goldman Sachs and its affiliates and employees, and funds or other entities they manage or in which they invest or have other economic interests or with which they co-invest, may at any time purchase, sell, hold or vote long or short positions and investments in securities, derivatives, loans, commodities, currencies, credit default swaps and other financial instruments of the Company, any other party to any transaction and any of their respective affiliates or any currency or commodity that may be involved in any transaction. Goldman Sachs Investment Banking maintains regular, ordinary course client service dialogues with clients and potential clients to review events, opportunities, and conditions in particular sectors and industries and, in that connection, Goldman Sachs may make reference to the Company, but Goldman Sachs will not disclose any confidential information received from the Company. The Confidential Information has been prepared based on historical financial information, forecasts and other information obtained by Goldman Sachs from publicly available sources, the management of the Company or other sources (approved for our use by the Company in the case of information from management and non-public information). In preparing the Confidential Information, Goldman Sachs has relied upon and assumed, without assuming any responsibility for independent verification, the accuracy and completeness of all of the financial, legal, regulatory, tax, accounting and other information provided to, discussed with or reviewed by us, and Goldman Sachs does not assume any liability for any such information. Goldman Sachs does not provide accounting, tax, legal or regulatory advice. Goldman Sachs has not made an independent evaluation or appraisal of the assets and liabilities (including any contingent, derivative or other off-balance sheet assets and liabilities) of the Company or any other party to any transaction or any of their respective affiliates and has no obligation to evaluate the solvency of the Company or any other party to any transaction under any state or federal laws relating to bankruptcy, insolvency or similar matters. The analyses contained in the Confidential Information do not purport to be appraisals nor do they necessarily reflect the prices at which businesses or securities actually may be sold or purchased. Goldman Sachs’ role in any due diligence review is limited solely to performing such a review as it shall deem necessary to support its own advice and analysis and shall not be on behalf of the Company. Analyses based upon forecasts of future results are not necessarily indicative of actual future results, which may be significantly more or less favorable than suggested by these analyses, and Goldman Sachs does not assume responsibility if future results are materially different from those forecasts. The Confidential Information does not address the underlying business decision of the Company to engage in any transaction, or the relative merits of any transaction or strategic alternative referred to herein as compared to any other transaction or alternative that may be available to the Company. The Confidential Information is necessarily based on economic, monetary, market and other conditions as in effect on, and the information made available to Goldman Sachs as of, the date of such Confidential Information and Goldman Sachs assumes no responsibility for updating or revising the Confidential Information based on circumstances, developments or events occurring after such date. The Confidential Information does not constitute any opinion, nor does the Confidential Information constitute a recommendation to the [Special Committee][Board], any security holder of the Company or any other person as to how to vote or act with respect to any transaction or any other matter. The Confidential Information, including this disclaimer, is subject to, and governed by, any written agreement between the Company, the Board and/or any committee thereof, on the one hand, and Goldman Sachs, on the other hand. The Confidential Information does not address, nor does Goldman Sachs express any view as to, the potential effects of volatility in the credit, financial and stock markets on the Company, any other party to any transaction or any transaction. Disclaimer |