
截至2022年9月23日的财政季度(F2Q‘23)截至2022年12月23日的财政季度(F3Q’23)截至2023年3月31日的财政季度(F4Q‘23)截至2023年6月30日的财政季度(F1Q’24)截至6月30日的TTM,2023年N et S销售总额$237.7$248.8$269.4$278.3$1,034.2销售成本105.6 106.2 116.4 120.3 448.5毛利$132.0$142.6$153.1 158.0 585.7购入无形资产摊销0.4 0.6 0.6 0.4 2.0基于股票的薪酬1.1 1.2 2.0 2.6 6.9非公认会计准则毛利$133.5$144.3$155.7$161.0$594.5GAAP毛利率56.2%58.0%57.8%57.8%57.5%20 GAAP对非GAAP营业毛利调整**由于四舍五入,项目总和可能不是总和
(以百万美元为单位)截至2021年9月24日的财政季度(F2Q‘22)截至2021年12月24日的财政季度(F3Q’22)截至2022年3月25日的财政季度(F4Q‘22)截至6月24日的财政季度,2022年第一季度S销售总额$193.6$186.6$200.3$217.8销售成本91.1 85.5 90.7 99.4毛利(公认会计准则)$102.5$101.2$109.6$118.4购进无形资产摊销0.3 0.3 0.3重组成本0.3-基于股票的薪酬0.7 0.7 1.2 0.8其他成本0.3 0.1 0.3-非公认会计准则毛利104.1$102。3$111.4$119.5非公认会计准则毛利53.8%54.8%55.6%54.9%21公认会计准则对非公认会计准则营业毛利调节**由于四舍五入,项目总和可能不能合计
截至2022年9月23日的财政季度(F2Q‘23)截至2022年12月23日的财政季度(F3Q’23)截至2023年3月31日的财政季度(F4Q‘23)截至2023年6月30日的财政季度(F1Q’24)截至6月30日的TTM,35.6 39.6 41.8 43.0 160.0交易相关成本0.2-0.2重组成本--0.10.1基于股票的薪酬1.7 3.2 3.5 2.9 11.2非公认会计准则研发支出33.7 36.4 38.3 40.1 148.5销售,一般和行政费用39.1 37.4 48.3 44.2 169.0与交易有关的成本0.1-0.6 3.1 3.8购进无形资产摊销-0.4 0.4重组成本0.1 0.3 0.5-0.9基于股票的薪酬5.4 4.6 5.1 5.6 20.6其他成本--5.9-5.9非公认会计准则销售,一般和行政费用33.6 32.5 36.1 35.2 137.3或有对价的公允价值变动(2.5)-(0.1)-(2.6)非公认会计准则调整总额5.0 8.1 15.7 11.9 40.6非公认会计准则营业费用$67.2$68.9$74.3$75.3$285.8非公认会计准则营业费用利润率(占净销售额的百分比)28.3%27.7%27.6%27.1%27.6%22GAAP至非GAAP营业费用对账**由于四舍五入,项目总和可能不会合计

(以百万美元为单位)截至2021年9月24日的财政季度(F2Q‘22)截至2021年12月24日的财政季度(F3Q’22)截至2022年3月25日的财政季度(F4Q‘22)截至6月24日的财政季度,2022年(F1Q‘23)营业费用(GAAP)$64.0$65.6$79.4$103.6研发费用(GAAP)29.6 30.3 32.4 33.9与交易相关的成本-0.2股票薪酬1.0 1.0 1.1 1.1非GAAP研发费用28.5 29.3 31.3 32.5销售,一般和行政费用(GAAP)34.1 38.0 46.8 70.0交易相关成本-1.1 0.4 1.6重组成本0.2 0.7-4.3基于股票的薪酬4.4 5.9 12.6 32.2其他成本0.6 0.4 0.2-非GAAP销售,一般和行政费用28.9 30.0 33.5 31.9或有对价的公允价值变动0.3(2.7)0.1(0.2)非GAAP调整总额6.5 6.3 14.5 39.2非GAAP营业费用$57.5$59.2$64.8$64.4非GAAP营业费用毛利(占净销售额的百分比)29.7%31.7%32.4%29.6%23 GAAP至非GAAP营业费用对账**由于四舍五入,项目总和可能不是总和
截至2022年9月23日的财政季度(F2Q‘23)截至2022年12月23日的财政季度(F3Q’23)截至2023年3月31日的财政季度(F4Q‘23)截至2023年6月30日的财政季度(F1Q’24)截至6月30日的TTM,2023年营业收入$59.8$65.6$63.1$70.7$259.3与交易相关的成本(2.2)-0.5 3.1 1.4购进无形资产摊销0.4 0.6 0.6 0.8 2.4重组成本0.1 0.3 0.6-0.9股票薪酬8.9 10.6 11.0 38.7其他成本--5.9-5.9非公认会计准则营业收入$66.3$75.5$81.4$85.6$308.8非公认会计准则营业利润率(占净销售额的百分比)27.9%30.3%30.2%30.8%29.9%24公认会计准则对非公认会计准则营业收入调节**由于四舍五入原因,项目总和可能不是总和
(以百万美元为单位)截至2021年9月24日的财政季度(F2Q‘22)截至2021年12月24日的财政季度(F3Q’22)截至2022年3月25日的财政季度(F4Q‘22)截至6月24日的财政季度,2022年第一季度营业收入(GAAP)$38.6$35.6$30.2$14.7与交易相关的成本0.3(1.6)0.5 1.6购入无形资产摊销0.3 0.3 0.3重组成本0.4 0.7 0.1 4.3基于股票的薪酬6.2 7.6 14.9 34.1其他成本0.9 0.5-非GAAP营业收入$46.6$43.1$46.5$55.0利润率(占净销售额的百分比)24.1%23.1%23.2%25.3%25 GAAP对非GAAP营业收入调节**由于四舍五入,项目总和可能不是总和
截至2022年9月23日的财政季度(F2Q‘23)截至2022年12月23日的财政季度(F3Q’23)截至2023年3月31日的财政季度(F4Q‘23)截至2023年6月30日的财政季度(F1Q’24)截至6月30日的TTM,净收益(GAAP)$50.6$64.6$62.0$60.9$238.1稀释后每股收益(GAAP)$0.26$0.33$0.32$0.31$1.22与交易相关的成本(2.2)-0.5 3.1 1.4外购无形摊销0.4 0.6 0.6 0.8 2.4重组成本0.1 0.3 0.6-0.9基于股票的薪酬8.2 8.9 10.6 11.0 38.7非公认会计准则净收益$59.8$68.8$71.6$76.5$276.7摊薄加权平均普通股192.6 193.9 195.0 195.0 194.3非公认会计准则摊薄每股收益$0.31$0.35$0.37$0.39$1.42 26公认会计准则对非公认会计准则每股收益调整**由于四舍五入,项目总和可能不是总和
(以百万美元为单位)截至2021年9月24日的财政季度(F2Q‘22)截至2021年12月24日的财政季度(F3Q’22)截至2022年3月25日的财政季度(F4Q‘22)截至6月24日的财政季度,2022年第一季度净收入(GAAP)$33.2$33.0$25.7$10.3稀释后每股收益(GAAP)$0.17$0.17$0.13$0.05交易相关成本0.3(1.6)0.5 1.6购入无形资产摊销0.3 0.3 0.3重组成本0.4 0.7 0.1 4.3股票薪酬6.2 7.6 14.9 34.1其他成本(0.8)(3.3)1.6 2.4对公认会计准则结果的调整对税收的影响(0.9)(0.6)(2.8)(5.9)非公认会计准则净收入$38.7$36.1$40.2$47.1摊薄加权平均普通股191.7 192.1 192.1 192.4非公认会计准则摊薄每股收益$0.2$0.19$0.21$0.24 27公认会计准则对非公认会计准则每股收益的调整**由于四舍五入,项目总和可能不能总计
28年度股东大会2021年8月公司演示文稿谢谢
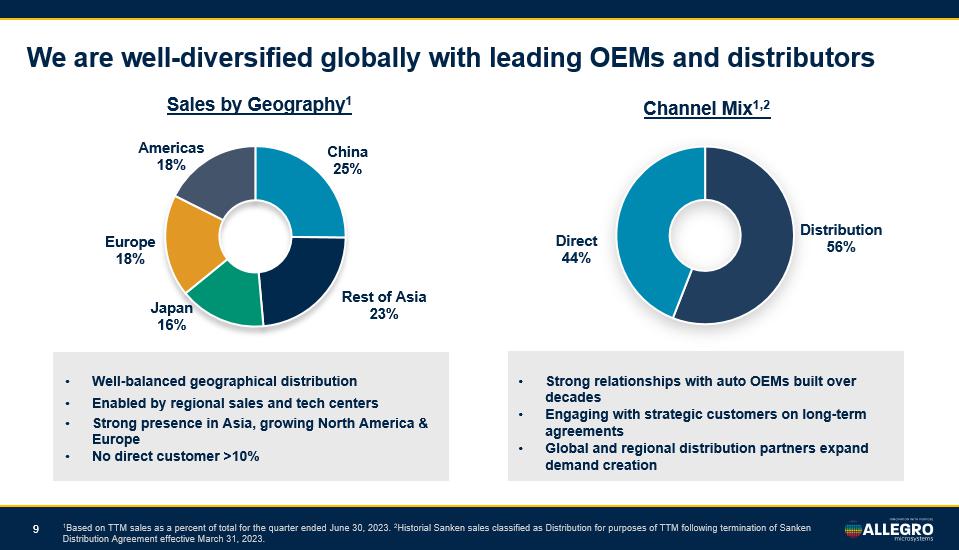
We are well - diversified globally with leading OEMs and distributors 1 Based on TTM sales as a percent of total for the quarter ended June 30, 2023. 2 Historial Sanken sales classified as Distribution for purposes of TTM following termination of Sanken Distribution Agreement effective March 31, 2023. Distribution 56% Direct 44% Channel Mix 1,2 • Strong relationships with auto OEMs built over decades • Engaging with strategic customers on long - term agreements • Global and regional distribution partners expand demand creation • Well - balanced geographical distribution • Enabled by regional sales and tech centers • Strong presence in Asia, growing North America & Europe • No direct customer >10% China 25% Rest of Asia 23% Japan 16% Europe 18% Americas 18% Sales by Geography 1 9
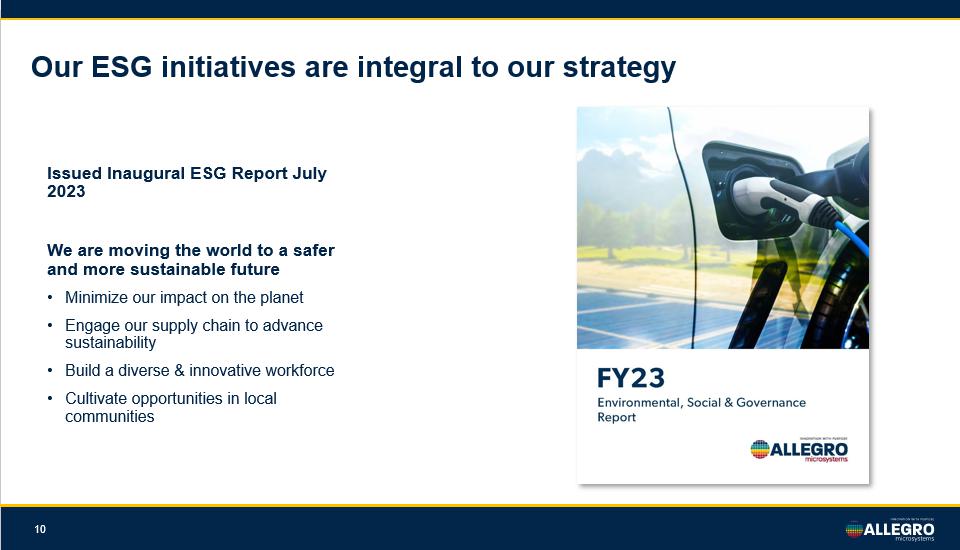
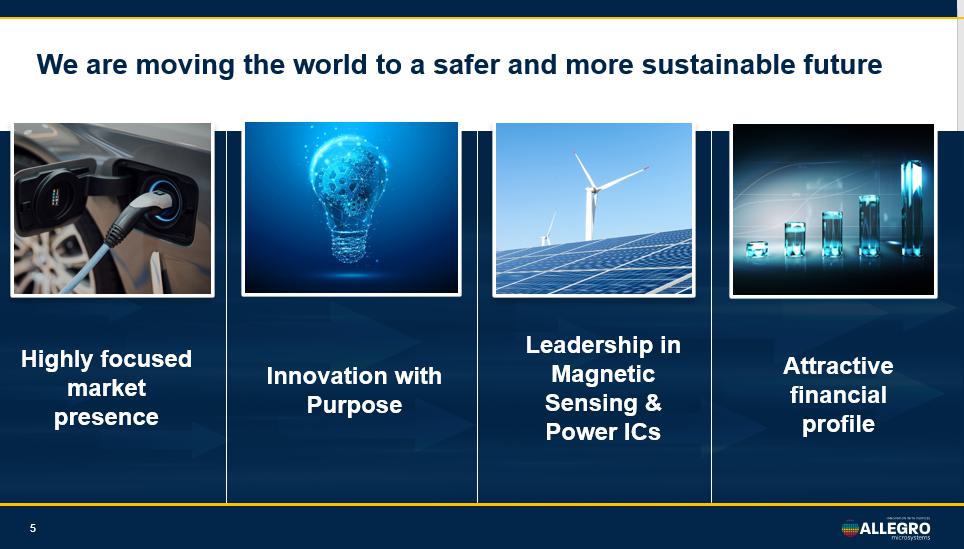
Our ESG initiatives are integral to our strategy 10 Issued Inaugural ESG Report July 2023 We are moving the world to a safer and more sustainable future • Minimize our impact on the planet • Engage our supply chain to advance sustainability • Build a diverse & innovative workforce • Cultivate opportunities in local communities
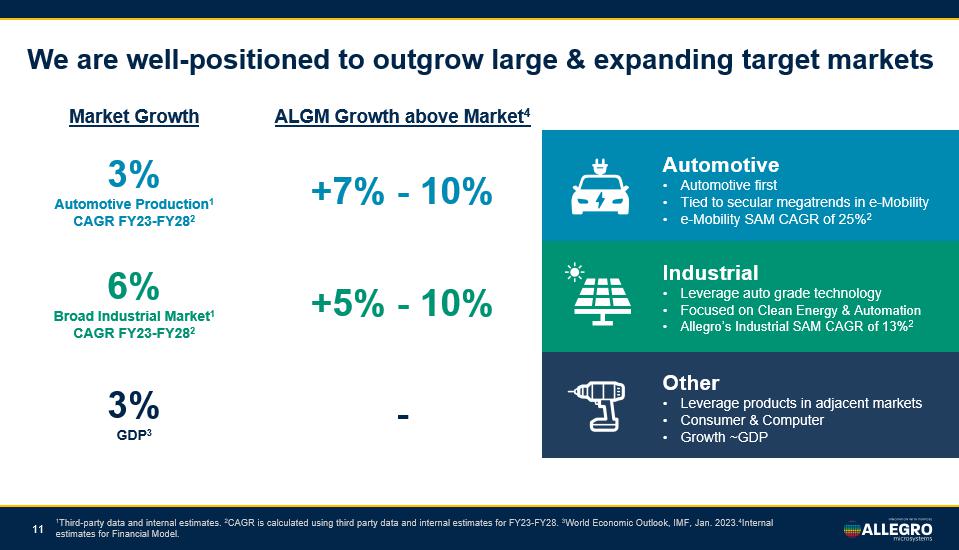
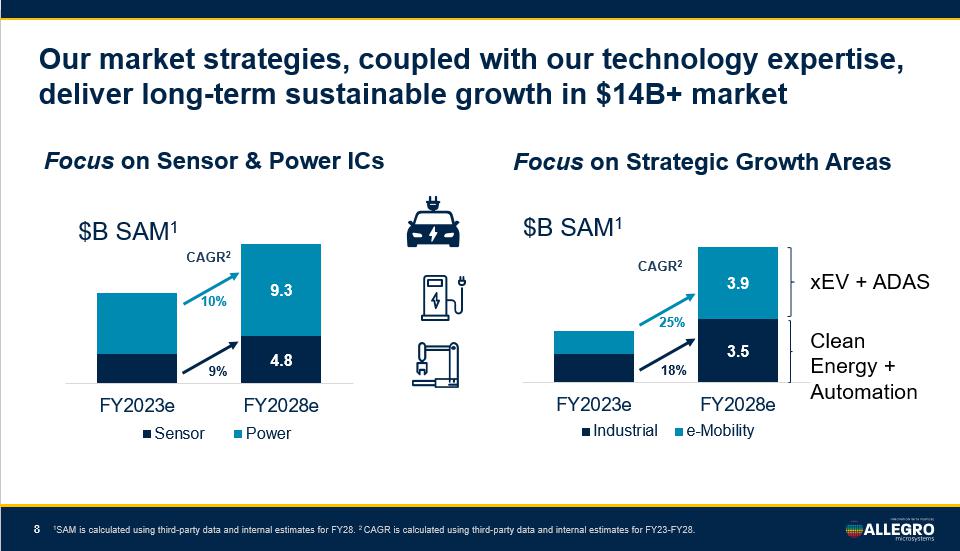
Industrial • Leverage auto grade technology • Focused on Clean Energy & Automation • Allegro’s Industrial SAM CAGR of 13% 2 Other • Leverage products in adjacent markets • Consumer & Computer • Growth ~GDP Automotive • Automotive first • Tied to secular megatrends in e - Mobility • e - Mobility SAM CAGR of 25% 2 We are well - positioned to outgrow large & expanding target markets 1 Third - party data and internal estimates. 2 CAGR is calculated using third party data and internal estimates for FY23 - FY28. 3 World Economic Outlook, IMF, Jan. 2023. 4 Internal estimates for Financial Model. Market Growth ALGM Growth above Market 4 3% Automotive Production 1 CAGR FY23 - FY28 2 +7% - 10% 6% Broad Industrial Market 1 CAGR FY23 - FY28 2 +5% - 10% 3% GDP 3 - 11
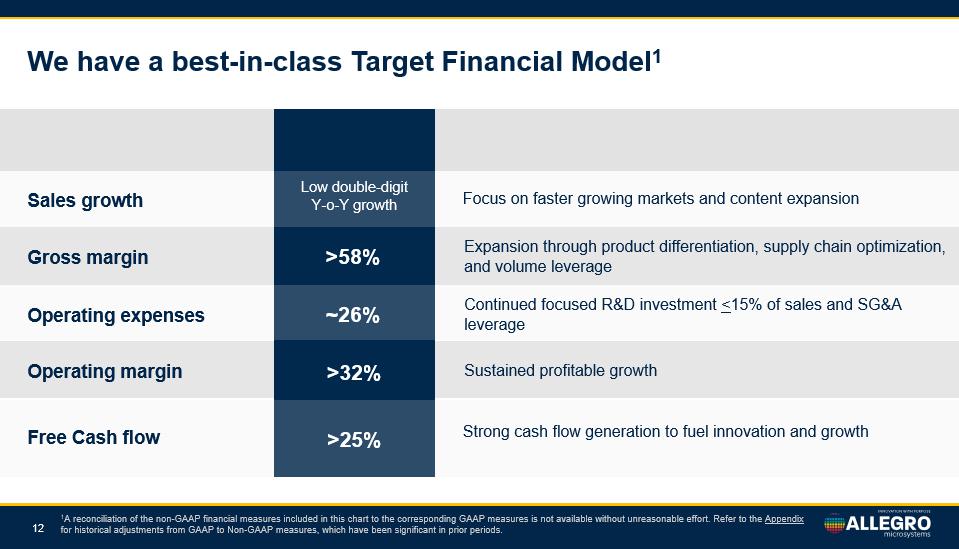
Gross margin Operating margin Expansion through product differentiation, supply chain optimization, and volume leverage Sustained profitable growth >58% >32% Sales growth Focus on faster growing markets and content expansion Low double - digit Y - o - Y growth Operating expenses Continued focused R&D investment 25% Strong cash flow generation to fuel innovation and growth We have a best - in - class Target Financial Model 1 1 A reconciliation of the non - GAAP financial measures included in this chart to the corresponding GAAP measures is not available w ithout unreasonable effort. Refer to the Appendix for historical adjustments from GAAP to Non - GAAP measures, which have been significant in prior periods. 12
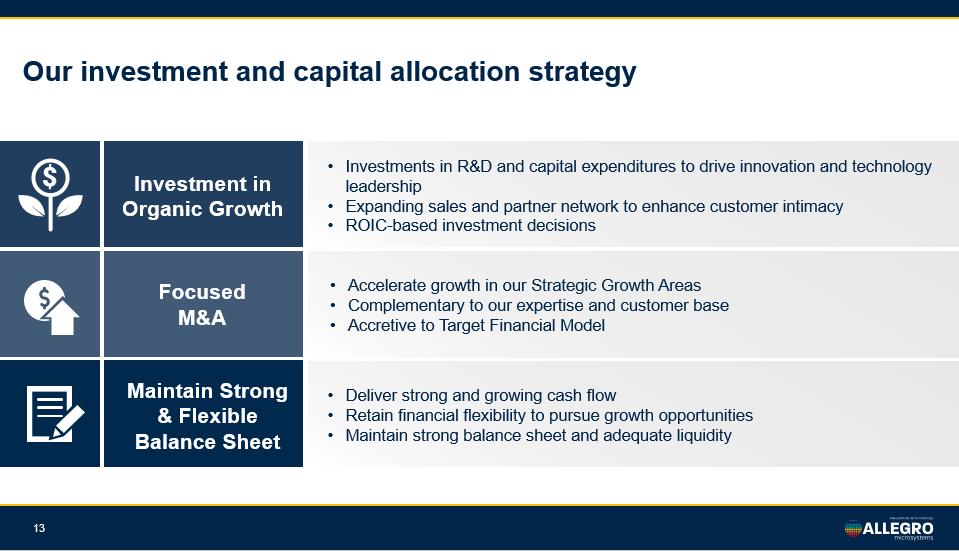
Maintain Strong & Flexible Balance Sheet Our investment and capital allocation strategy • Deliver strong and growing cash flow • Retain financial flexibility to pursue growth opportunities • Maintain strong balance sheet and adequate liquidity Investment in Organic Growth • Investments in R&D and capital expenditures to drive innovation and technology leadership • Expanding sales and partner network to enhance customer intimacy • ROIC - based investment decisions Focused M&A • Accelerate growth in our Strategic Growth Areas • Complementary to our expertise and customer base • Accretive to Target Financial Model 13
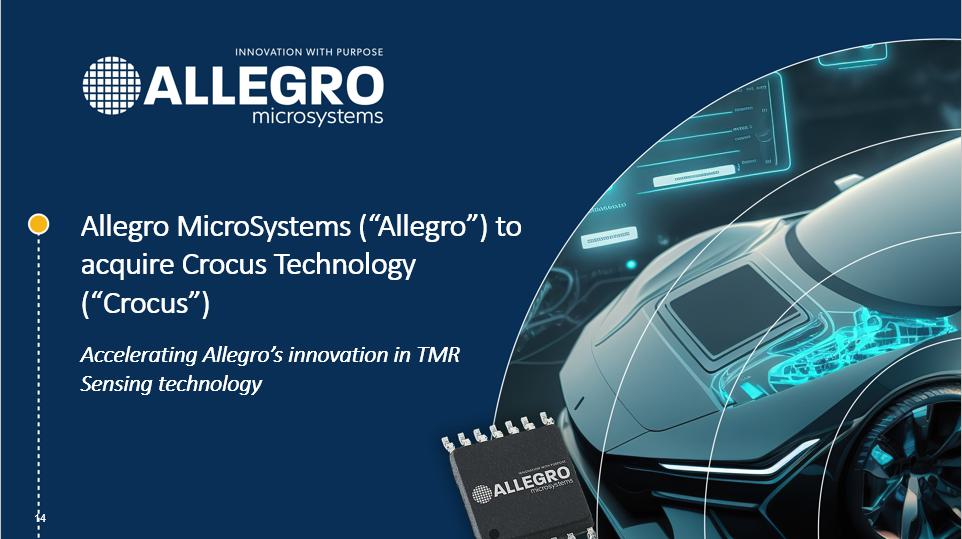
Accelerating Allegro’s innovation in TMR Sensing technology Allegro MicroSystems (“Allegro”) to acquire Crocus Technology (“Crocus”) 14
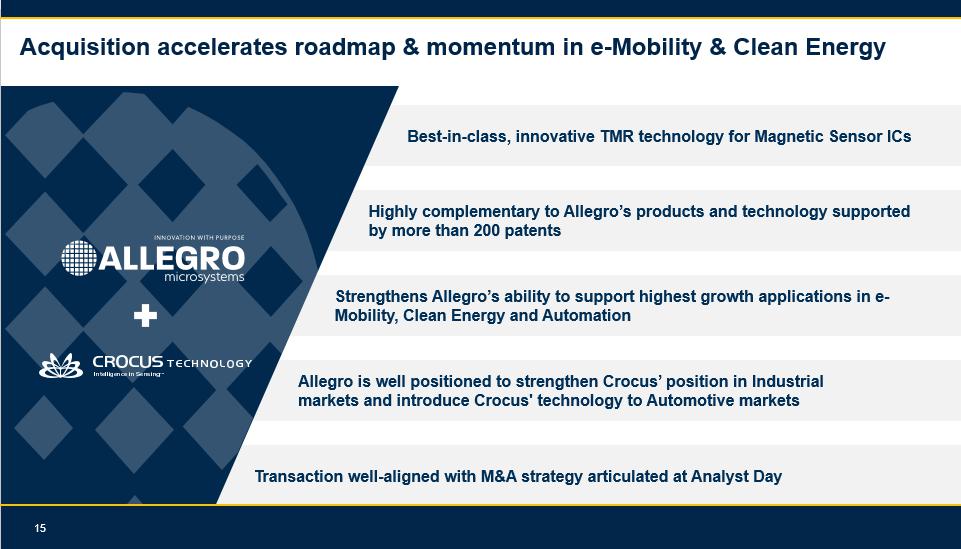
15 Acquisition accelerates roadmap & momentum in e - Mobility & Clean Energy Best - in - class, innovative TMR technology for Magnetic Sensor ICs Transaction well - aligned with M&A strategy articulated at Analyst Day Highly complementary to Allegro’s products and technology supported by more than 200 patents Strengthens Allegro’s ability to support highest growth applications in e - Mobility, Clean Energy and Automation Allegro is well positioned to strengthen Crocus’ position in Industrial markets and introduce Crocus' technology to Automotive markets 15
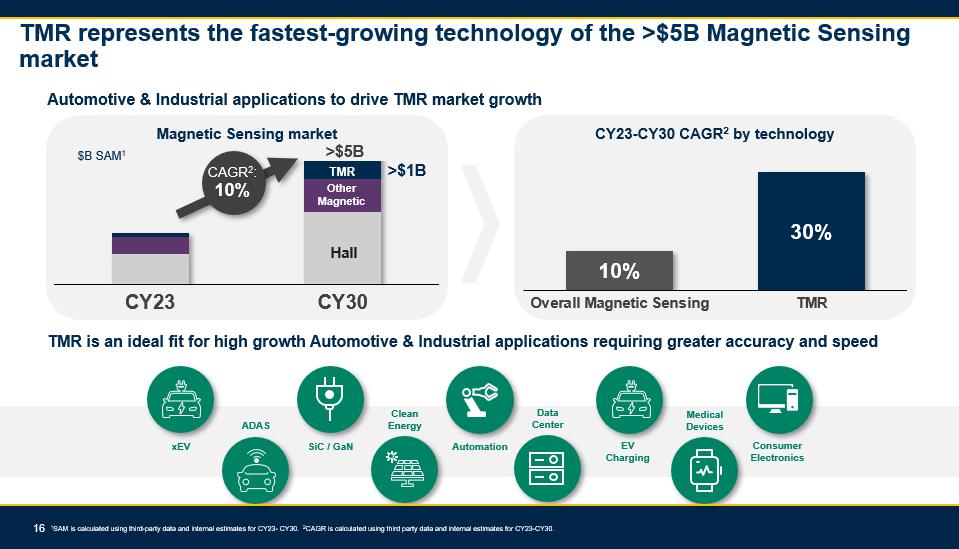
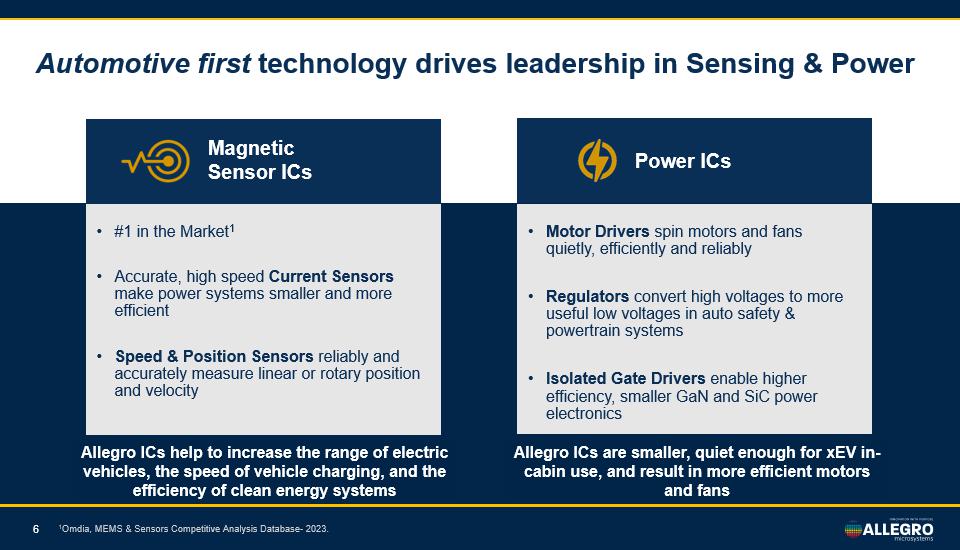
16 TMR represents the fastest - growing technology of the >$5B Magnetic Sensing market Automotive & Industrial applications to drive TMR market growth TMR is an ideal fit for high growth Automotive & Industrial applications requiring greater accuracy and speed xEV ADAS SiC / GaN Automation Clean Energy EV Charging Data Center Consumer Electronics Medical Devices 1 SAM is calculated using third - party data and internal estimates for CY23 - CY30. 2 CAGR is calculated using third party data and internal estimates for CY23 - CY30. 10% 30% Overall Magnetic Sensing TMR CY23 - CY30 CAGR 2 by technology CY23 CY30 CAGR 2 : 10% Magnetic Sensing market $B SAM 1 >$5B Hall Other Magnetic TMR >$1B 16
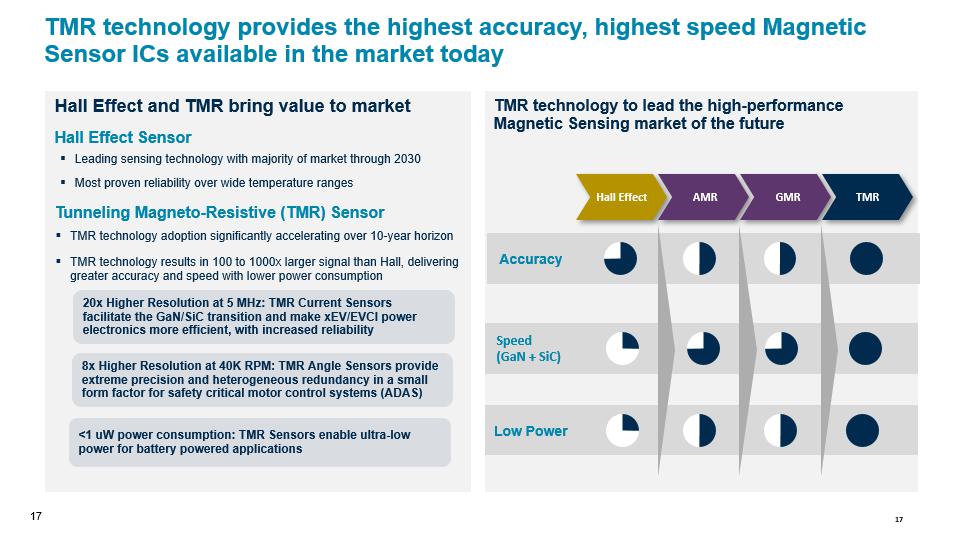
17 TMR technology provides the highest accuracy, highest speed Magnetic Sensor ICs available in the market today TMR technology to lead the high - performance Magnetic Sensing market of the future Hall Effect and TMR bring value to market Hall Effect AMR GMR TMR ▪ Leading sensing technology with majority of market through 2030 ▪ Most proven reliability over wide temperature ranges ▪ TMR technology adoption significantly accelerating over 10 - year horizon ▪ TMR technology results in 100 to 1000x larger signal than Hall, delivering greater accuracy and speed with lower power consumption Hall Effect Sensor Tunneling Magneto - Resistive (TMR) Sensor 20x Higher Resolution at 5 MHz: TMR Current Sensors facilitate the GaN / SiC transition and make xEV /EVCI power electronics more efficient, with increased reliability 8x Higher Resolution at 40K RPM: TMR Angle Sensors provide extreme precision and heterogeneous redundancy in a small form factor for safety critical motor control systems (ADAS)
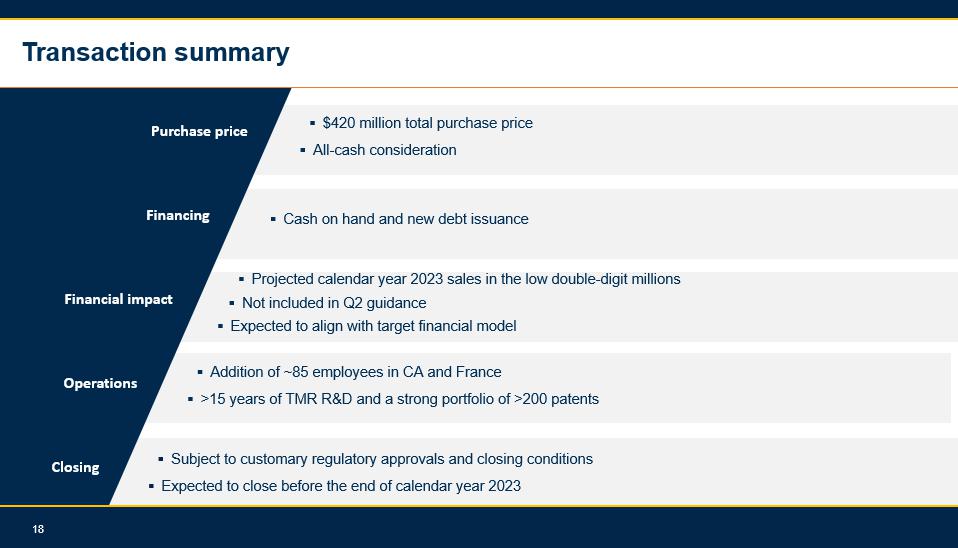
18 ▪ $420 million total purchase price ▪ All - cash consideration ▪ Cash on hand and new debt issuance ▪ Subject to customary regulatory approvals and closing conditions ▪ Expected to close before the end of calendar year 2023 Transaction summary Purchase price Financing Financial impact Closing ▪ Addition of ~85 employees in CA and France ▪ >15 years of TMR R&D and a strong portfolio of >200 patents Operations ▪ Projected calendar year 2023 sales in the low double - digit millions ▪ Not included in Q2 guidance ▪ Expected to align with target financial model 18

19 Annual Shareholder Meeting Company Presentation August 2021 GAAP to Non - GAAP Reconciliations
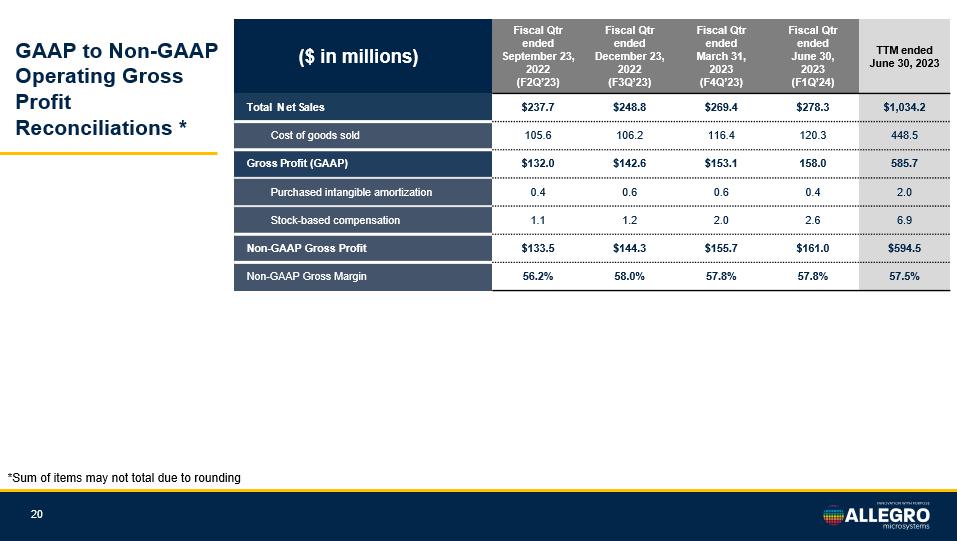
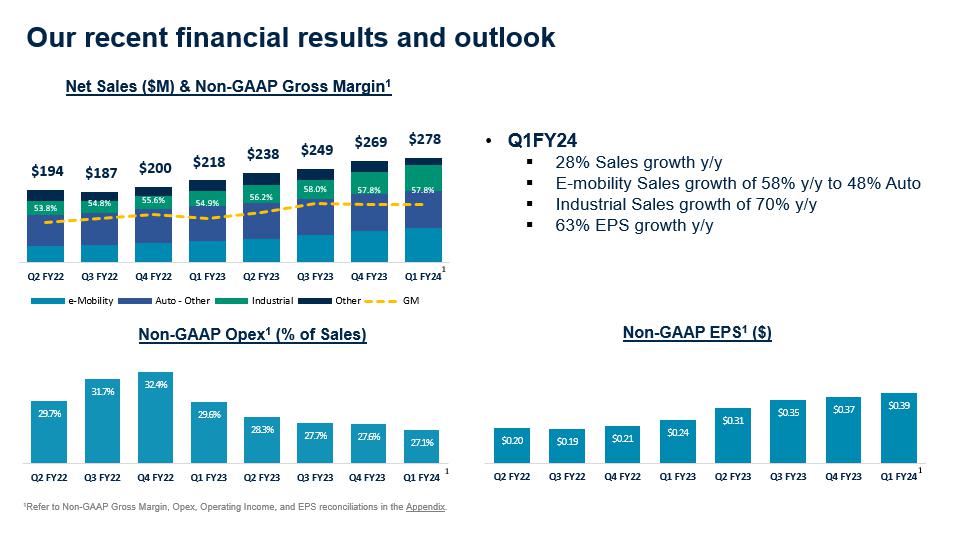
($ in millions) Fiscal Qtr ended September 23, 2022 (F2Q’23) Fiscal Qtr ended December 23, 2022 (F3Q’23) Fiscal Qtr ended March 31, 2023 (F4Q’23) Fiscal Qtr ended June 30, 2023 (F1Q’24) TTM ended June 30, 2023 Total N et S ales $237.7 $248.8 $269.4 $278.3 $1,034.2 Cost of goods sold 105.6 106.2 116.4 120.3 448.5 Gross P rofit (GAAP) $132.0 $142.6 $153.1 158.0 585.7 Purchased intangible amortization 0.4 0.6 0.6 0.4 2.0 Stock - based compensation 1.1 1.2 2.0 2.6 6.9 Non - GAAP Gross Profit $133.5 $144.3 $155.7 $161.0 $594.5 Non - GAAP Gross Margin 56.2% 58.0% 57.8% 57.8% 57.5% 20 GAAP to Non - GAAP Operating Gross Profit Reconciliations * *Sum of items may not total due to rounding

($ in millions) Fiscal Qtr ended September 24, 2021 (F2Q’22) Fiscal Qtr ended December 24, 2021 (F3Q’22) Fiscal Qtr ended March 25, 2022 (F4Q’22) Fiscal Qtr ended June 24, 2022 (F1Q’23) Total N et S ales $193.6 $186.6 $200.3 $217.8 Cost of goods sold 91.1 85.5 90.7 99.4 Gross P rofit (GAAP) $102.5 $101.2 $109.6 $118.4 Purchased intangible amortization 0.3 0.3 0.3 0.3 Restructuring costs 0.3 — — — Stock - based compensation 0.7 0.7 1.2 0.8 Other costs 0.3 0.1 0.3 — Non - GAAP Gross Profit $104.1 $102.3 $111.4 $119.5 Non - GAAP Gross Margin 53.8% 54.8% 55.6% 54.9% 21 GAAP to Non - GAAP Operating Gross Profit Reconciliations * *Sum of items may not total due to rounding

($ in millions) Fiscal Qtr ended September 23, 2022 (F2Q’23) Fiscal Qtr ended December 23, 2022 (F3Q’23) Fiscal Qtr ended March 31, 2023 (F4Q’23) Fiscal Qtr ended June 30, 2023 (F1Q’24) TTM ended June 30, 2023 Operating Expenses (GAAP) $72.2 $77.0 $90.0 $87.2 $326.3 Research and Development Expenses (GAAP) 35.6 39.6 41.8 43.0 160.0 Transaction - related costs 0.2 — — — 0.2 Restructuring costs — — 0.1 — 0.1 Stock - based compensation 1.7 3.2 3.5 2.9 11.2 Non - GAAP Research and Development Expenses 33.7 36.4 38.3 40.1 148.5 Selling, General and Administrative Expenses (GAAP) 39.1 37.4 48.3 44.2 169.0 Transaction - related costs 0.1 — 0.6 3.1 3.8 Purchased intangible amortization — — — 0.4 0.4 Restructuring costs 0.1 0.3 0.5 — 0.9 Stock - based compensation 5.4 4.6 5.1 5.6 20.6 Other costs — — 5.9 — 5.9 Non - GAAP Selling, General and Administrative Expenses 33.6 32.5 36.1 35.2 137.3 Change in fair value of contingent consideration (2.5) — (0.1) — (2.6) Total Non - GAAP Adjustments 5.0 8.1 15.7 11.9 40.6 Non - GAAP Operating Expenses $67.2 $68.9 $74.3 $75.3 $285.8 Non - GAAP Operating Expenses Margin (% of net sales) 28.3% 27.7% 27.6% 27.1% 27.6% 22 GAAP to Non - GAAP Operating Expenses Reconciliations * *Sum of items may not total due to rounding

($ in millions) Fiscal Qtr ended September 24, 2021 (F2Q’22) Fiscal Qtr ended December 24, 2021 (F3Q’22) Fiscal Qtr ended March 25, 2022 (F4Q’22) Fiscal Qtr ended June 24, 2022 (F1Q’23) Operating Expenses (GAAP) $64.0 $65.6 $79.4 $103.6 Research and Development Expenses (GAAP) 29.6 30.3 32.4 33.9 Transaction - related costs — — — 0.2 Stock - based compensation 1.0 1.0 1.1 1.1 Non - GAAP Research and Development Expenses 28.5 29.3 31.3 32.5 Selling, General and Administrative Expenses (GAAP) 34.1 38.0 46.8 70.0 Transaction - related costs — 1.1 0.4 1.6 Restructuring costs 0.2 0.7 — 4.3 Stock - based compensation 4.4 5.9 12.6 32.2 Other costs 0.6 0.4 0.2 — Non - GAAP Selling, General and Administrative Expenses 28.9 30.0 33.5 31.9 Change in fair value of contingent consideration 0.3 (2.7) 0.1 (0.2) Total Non - GAAP Adjustments 6.5 6.3 14.5 39.2 Non - GAAP Operating Expenses $57.5 $59.2 $64.8 $64.4 Non - GAAP Operating Expenses Margin (% of net sales) 29.7% 31.7% 32.4% 29.6% 23 GAAP to Non - GAAP Operating Expenses Reconciliations * *Sum of items may not total due to rounding
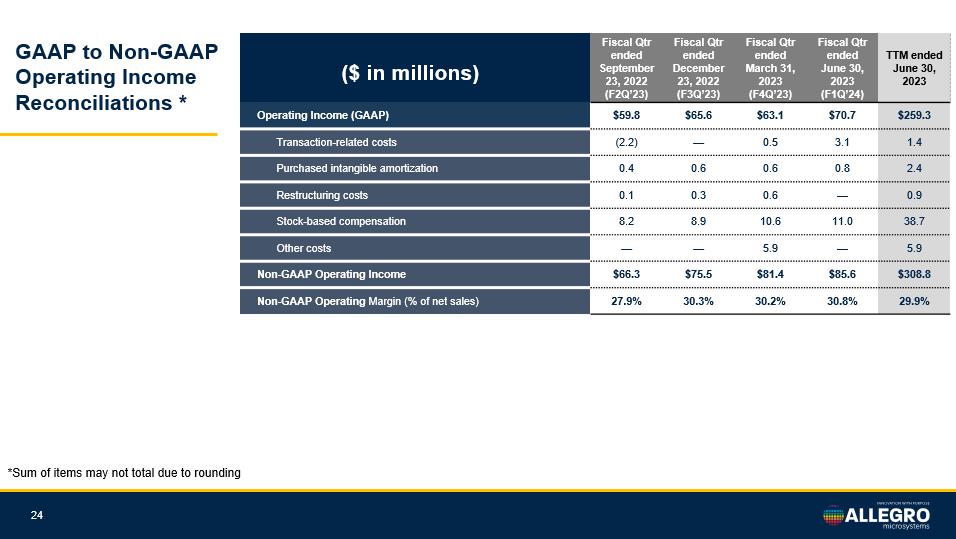
($ in millions) Fiscal Qtr ended September 23, 2022 (F2Q’23) Fiscal Qtr ended December 23, 2022 (F3Q’23) Fiscal Qtr ended March 31, 2023 (F4Q’23) Fiscal Qtr ended June 30, 2023 (F1Q’24) TTM ended June 30, 2023 Operating Income (GAAP) $59.8 $65.6 $63.1 $70.7 $259.3 Transaction - related costs (2.2) — 0.5 3.1 1.4 Purchased intangible amortization 0.4 0.6 0.6 0.8 2.4 Restructuring costs 0.1 0.3 0.6 — 0.9 Stock - based compensation 8.2 8.9 10.6 11.0 38.7 Other costs — — 5.9 — 5.9 Non - GAAP Operating Income $66.3 $75.5 $81.4 $85.6 $308.8 Non - GAAP Operating Margin (% of net sales) 27.9% 30.3% 30.2% 30.8% 29.9% 24 GAAP to Non - GAAP Operating Income Reconciliations * *Sum of items may not total due to rounding
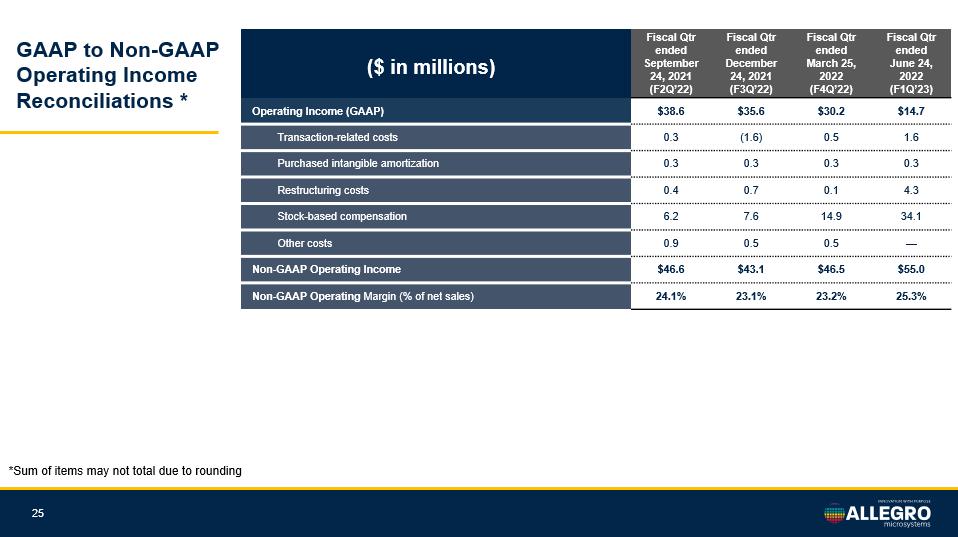
($ in millions) Fiscal Qtr ended September 24, 2021 (F2Q’22) Fiscal Qtr ended December 24, 2021 (F3Q’22) Fiscal Qtr ended March 25, 2022 (F4Q’22) Fiscal Qtr ended June 24, 2022 (F1Q’23) Operating Income (GAAP) $38.6 $35.6 $30.2 $14.7 Transaction - related costs 0.3 (1.6) 0.5 1.6 Purchased intangible amortization 0.3 0.3 0.3 0.3 Restructuring costs 0.4 0.7 0.1 4.3 Stock - based compensation 6.2 7.6 14.9 34.1 Other costs 0.9 0.5 0.5 — Non - GAAP Operating Income $46.6 $43.1 $46.5 $55.0 Non - GAAP Operating Margin (% of net sales) 24.1% 23.1% 23.2% 25.3% 25 GAAP to Non - GAAP Operating Income Reconciliations * *Sum of items may not total due to rounding

($ in millions) Fiscal Qtr ended September 23, 2022 (F2Q’23) Fiscal Qtr ended December 23, 2022 (F3Q’23) Fiscal Qtr ended March 31, 2023 (F4Q’23) Fiscal Qtr ended June 30, 2023 (F1Q’24) TTM ended June 30, 2023 Net Income (GAAP) $50.6 $64.6 $62.0 $60.9 $238.1 Diluted Earnings per Share (GAAP) $0.26 $0.33 $0.32 $0.31 $1.22 Transaction - related costs (2.2) — 0.5 3.1 1.4 Purchased intangible amortization 0.4 0.6 0.6 0.8 2.4 Restructuring costs 0.1 0.3 0.6 — 0.9 Stock - based compensation 8.2 8.9 10.6 11.0 38.7 Other costs 1.0 (6.0) 0.8 4.6 0.4 Tax effect of adjustments to GAAP results 1.7 0.5 (3.5) (3.8) (5.2) Non - GAAP Net Income $59.8 $68.8 $71.6 $76.5 $276.7 Diluted weighted average common shares 192.6 193.9 195.0 195.0 194.3 Non - GAAP Diluted Earnings per Share $0.31 $0.35 $0.37 $0.39 $1.42 26 GAAP to Non - GAAP Earnings per Share Reconciliations * *Sum of items may not total due to rounding
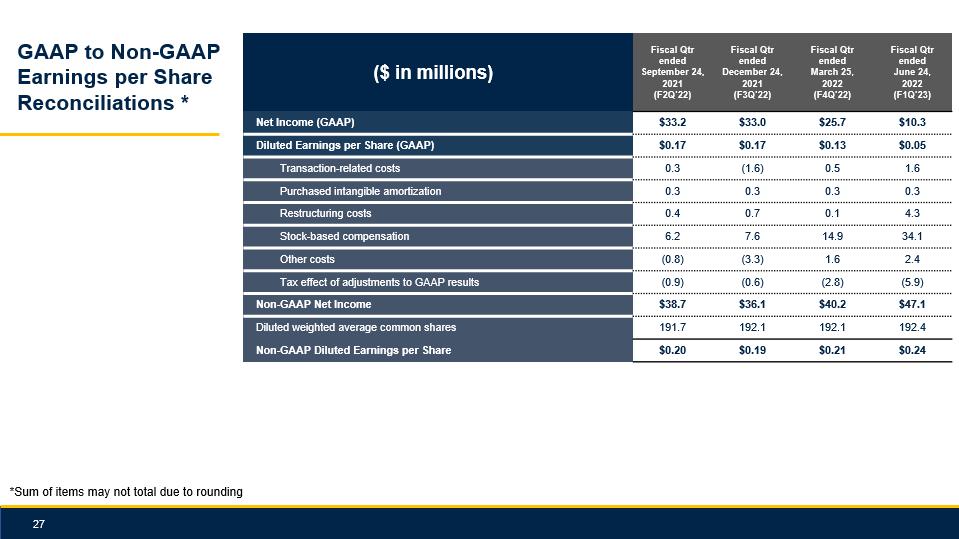
($ in millions) Fiscal Qtr ended September 24, 2021 (F2Q’22) Fiscal Qtr ended December 24, 2021 (F3Q’22) Fiscal Qtr ended March 25, 2022 (F4Q’22) Fiscal Qtr ended June 24, 2022 (F1Q’23) Net Income (GAAP) $33.2 $33.0 $25.7 $10.3 Diluted Earnings per Share (GAAP) $0.17 $0.17 $0.13 $0.05 Transaction - related costs 0.3 (1.6) 0.5 1.6 Purchased intangible amortization 0.3 0.3 0.3 0.3 Restructuring costs 0.4 0.7 0.1 4.3 Stock - based compensation 6.2 7.6 14.9 34.1 Other costs (0.8) (3.3) 1.6 2.4 Tax effect of adjustments to GAAP results (0.9) (0.6) (2.8) (5.9) Non - GAAP Net Income $38.7 $36.1 $40.2 $47.1 Diluted weighted average common shares 191.7 192.1 192.1 192.4 Non - GAAP Diluted Earnings per Share $0.20 $0.19 $0.21 $0.24 27 GAAP to Non - GAAP Earnings per Share Reconciliations * *Sum of items may not total due to rounding

28 Annual Shareholder Meeting Company Presentation August 2021 Thank you