
$Walt Disney Company(DIS.US)$ hit a new all-time high of $203.02 on March 8 despite many of its parks, hotels and cruise ships having brought in very little or no revenue over the course of the pandemic.
The company has been able to survive, and thrive even, largely thanks to its streaming service Disney+. A recent report shows the number of monthly Disney+ subscribers may be slowing, however, and during the first half of 2021 Disney's "Luka" was the company's only movie that made the top streamed list.
As COVID-19 vaccinations ramp up globally people will likely spend less time at streaming and more time out. Pent-up demand for the travel and entertainment segments of Disney’s portfolio will likely provide the company a way to offset slower streaming growth.
Since hitting its all-time high, Disney's stock fell into a slow downtrend but has recently begun to tighten and looks ready to take a break.
The Disney Chart: After falling into a downtrend, making lower lows and lower highs, Disney's stock put in a bottom at $171.89 on May 19. Since then, the stock has tightened into a triangle and put in a series of higher lows while still making lower highs. If the triangle pattern is recognized, Disney's stock should break up or down from it before it meets the apex on July 15.
On Friday, Disney's stock attempted to break up bullishly from the downward sloping line of the triangle but failed. The stock printed either a bullish hammer candlestick or a bearish hanging man candlestick on the daily chart. Monday's price action will determine which of the two candlesticks is recognized.
Disney is trading above the eight-day and 21-day exponential moving averages (EMAs) with the eight-day EMA trending slightly above the 21-day EMA, both of which are bullish indicators. Disney is also trading above the 200-day simple moving average (SMA), which indicates overall sentiment in the stock is bullish. Because all three above indicators are directly below Disney's stock price, they're also acting as support.
Disney has two gaps below on its chart with the first one between $157 and $160 and the second between $128 and $133. Because gaps fill 90% of the time, it's likely Disney's stock will eventually trade down toward those levels although, especially with the lowest gap, it could take many months or even years to fill.
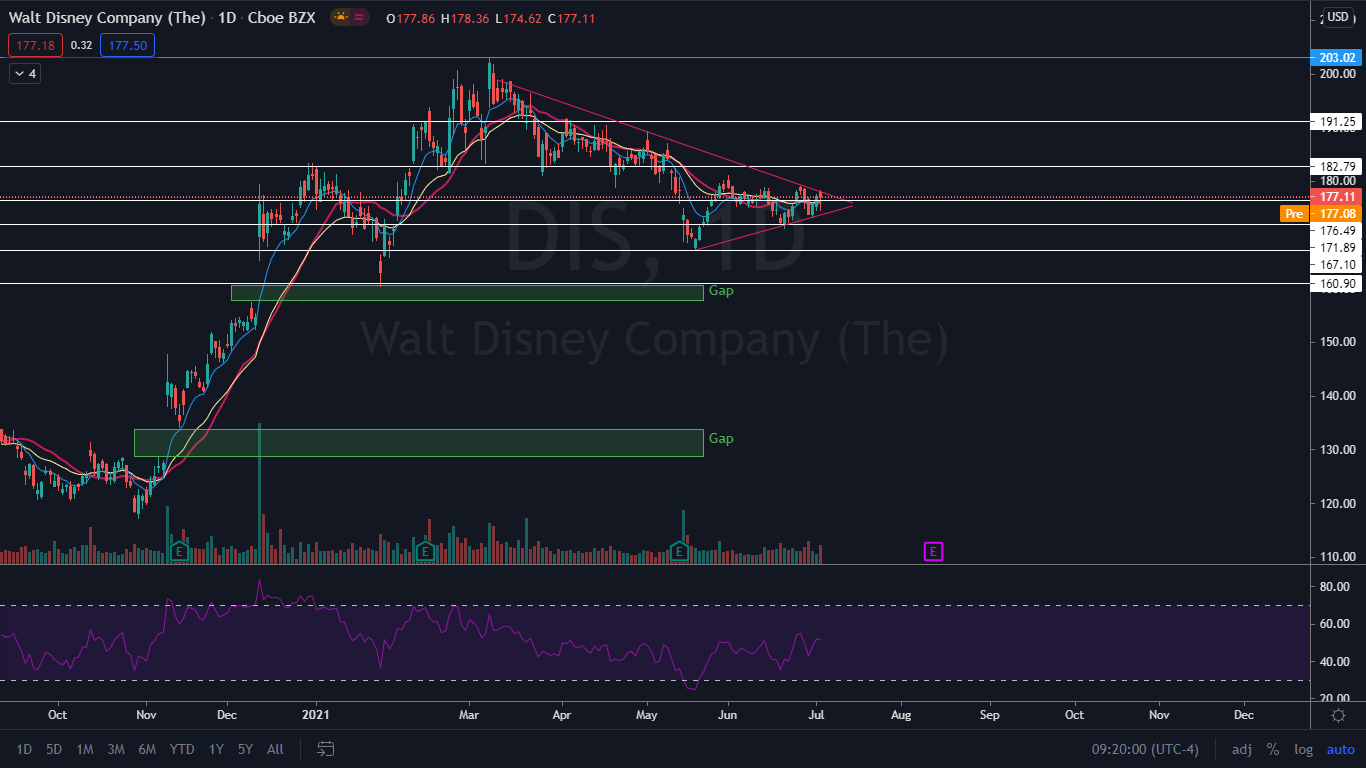
Bulls want to see Disney's stock break up bullishly from the triangle and for big bullish volume to help it regain $182.79 with momentum. If it can clear that level, it has room to move up toward $191.25.
Bears want to see Disney break down below the triangle and loss support of the two EMAs and 200-day SMA. Disney has a lower support at the $176.49 mark, but if it were to lose the level it could fall toward the $171 area.