Market Temperature (11/02)
The fear and greed index was developed by CNNMoney to measure two of the primary emotions that influence how much investors are willing to pay for stocks.
The fear and greed index is measured on a daily, weekly, monthly, and yearly basis. In theory, the index can be used to gauge whether the stock market is fairly priced. This is based on the logic that excessive fear tends to drive down share prices, and too much greed tends to have the opposite effect.
Be fearful when others are greedy. Be greedy when others are fearful.
---Warren Buffett
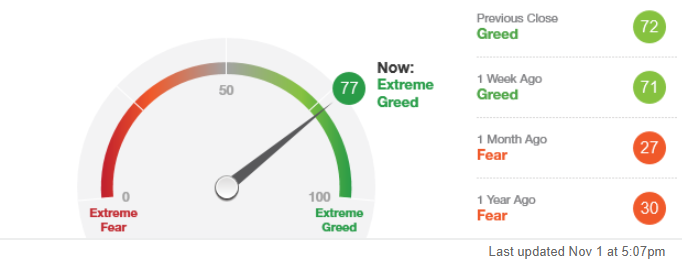
Fear & Greed Index
What emotion is driving the market?
What emotion is driving the market?
Market Momentum: Extreme Greed
The S&P 500 is 5.75% above its 125-day average. This is further above the average than has been typical during the last two years and rapid increases like this often indicate extreme greed.
The S&P 500 is 5.75% above its 125-day average. This is further above the average than has been typical during the last two years and rapid increases like this often indicate extreme greed.
Last changed Oct 27 from a Greed rating.

Stock Price Strength: Fear
The number of stocks hitting 52-week highs exceeds the number hitting lows but is at the lower end of its range, indicating fear.
The number of stocks hitting 52-week highs exceeds the number hitting lows but is at the lower end of its range, indicating fear.
Last changed Oct 27 from an Extreme Fear rating.

Market Volatility: Neutral
The CBOE Volatility Index (VIX) is at 16.41. This is a neutral reading and indicates that market risks appear low.
The CBOE Volatility Index (VIX) is at 16.41. This is a neutral reading and indicates that market risks appear low.
Last changed Oct 4 from an Extreme Fear rating.

Disclaimer: Moomoo Technologies Inc. is providing this content for information and educational use only.
Read more


Comment
Sign in to post a comment

Moomoo News Official Account
Let's find out what is trending on the internet🔥🔥🔥
Hot stuffs from Reddit/Stocktwits/Ins
8299Followers
9Following
12KVisitors
Follow
Mike Hunt : Looks like it’s time to be a bit fearful
the train Mike Hunt: